 Buy $GGs
SAND Price Analysis: Sandbox Price Losses 50% Retracement Level, Good Time to Buy?


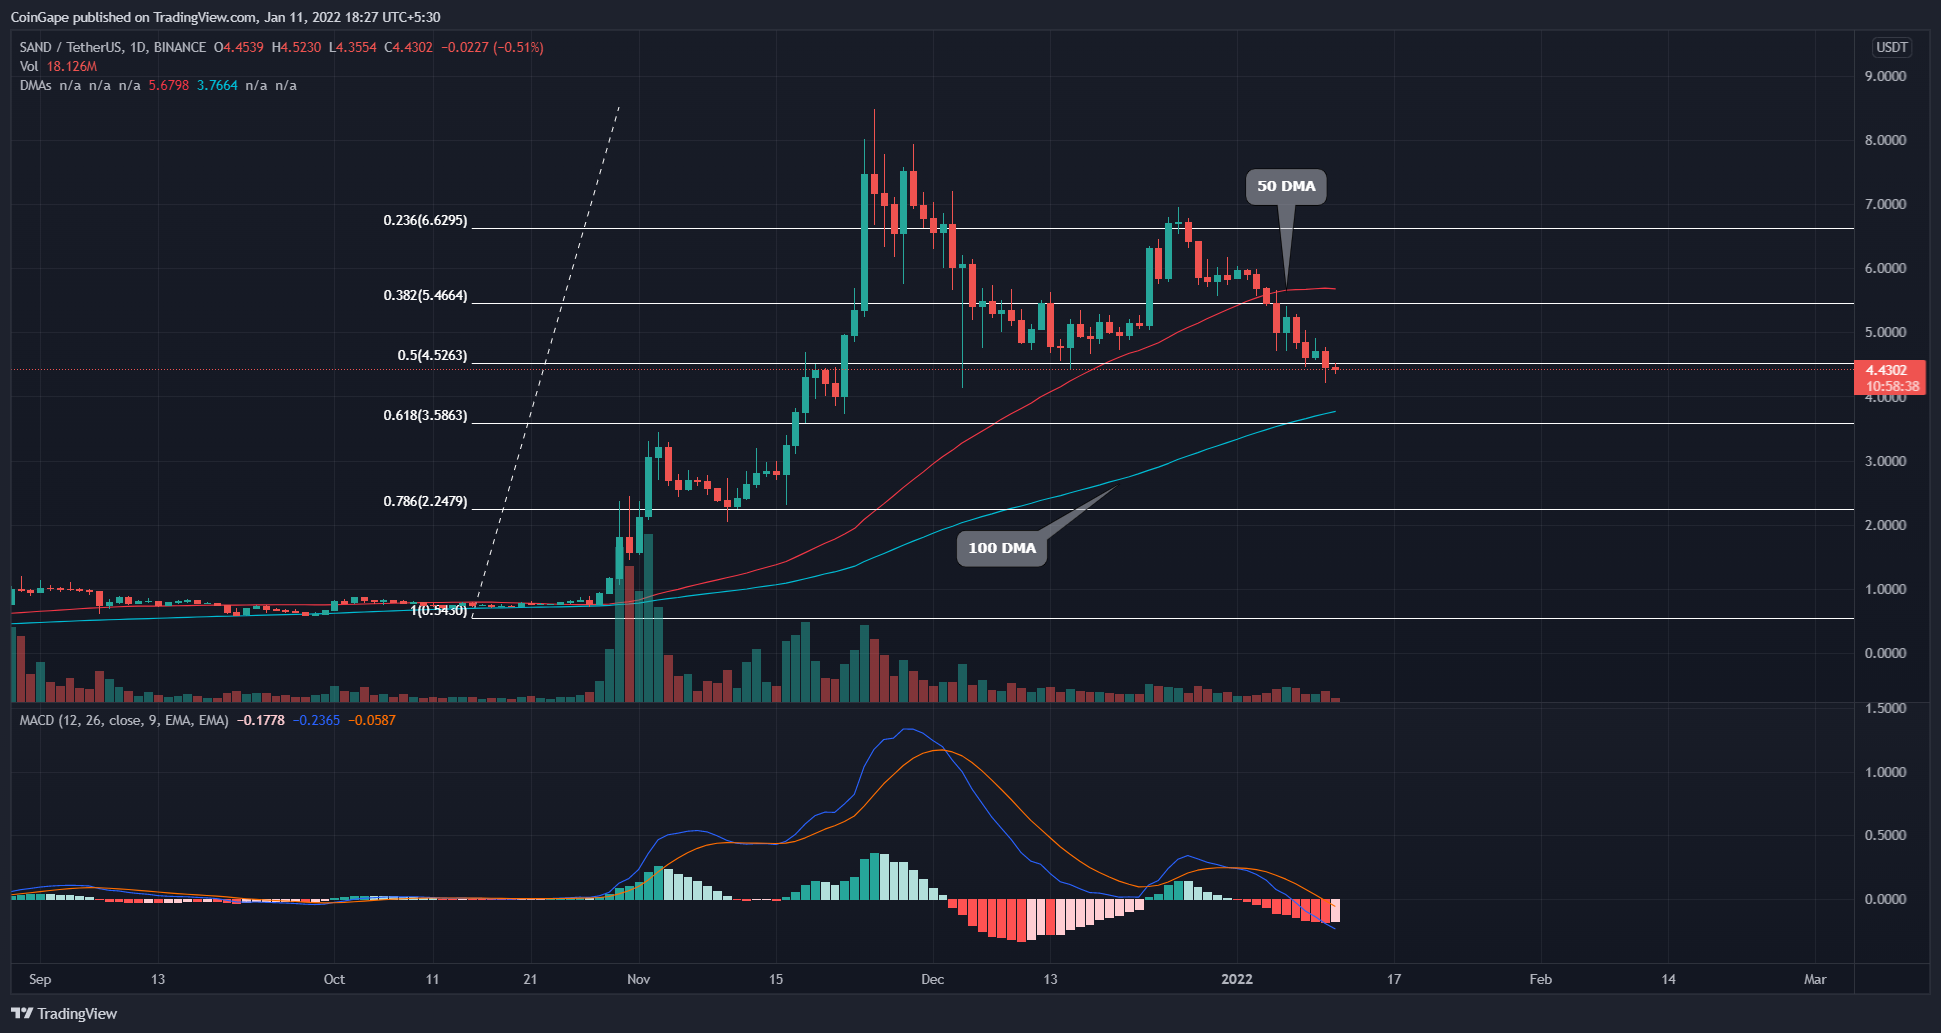
Entering the year 2022, the market sellers took an upper hand over the SAND price. The pair was rejected from the $7 mark and lost 34% of its value by dropping to the $4.48 mark. The price has recently plunged below the 0.5 FIB level, indicating the token could extend the correction phase.
Key technical points:
- The SAND price RSI chart shows a bullish divergence in the 4-hour time frame chart
- The daily-MACD indicator’s lines slip below the neutral zone
- The 24-hour trading volume in the Sandbox token is $3.1 billion, indicating a 0.83% loss.
 Source-Tradingview
Previously when we covered an article on Sandbox token, this pair was riding its 2021 Christmas rally. However, the price couldn’t pass the $7 mark, and by experiencing a strong supply, the token was immediately rejected with an evening star pattern.
The recent bloodbath in the crypto market added to the ongoing selling and dropped the price even below the 0.5 Fibonacci retracement level.
The correction phase is the SAND price has engulfed the 20 and 50 DMA lines. However, the overall trend for this token is still bullish as it is trading above the 100 and 200 DMA.
The Moving average convergence divergence indicator projects the MACD and signal lines have just dropped below the neutral zone(0.00), indicating the increasing bearish momentum.
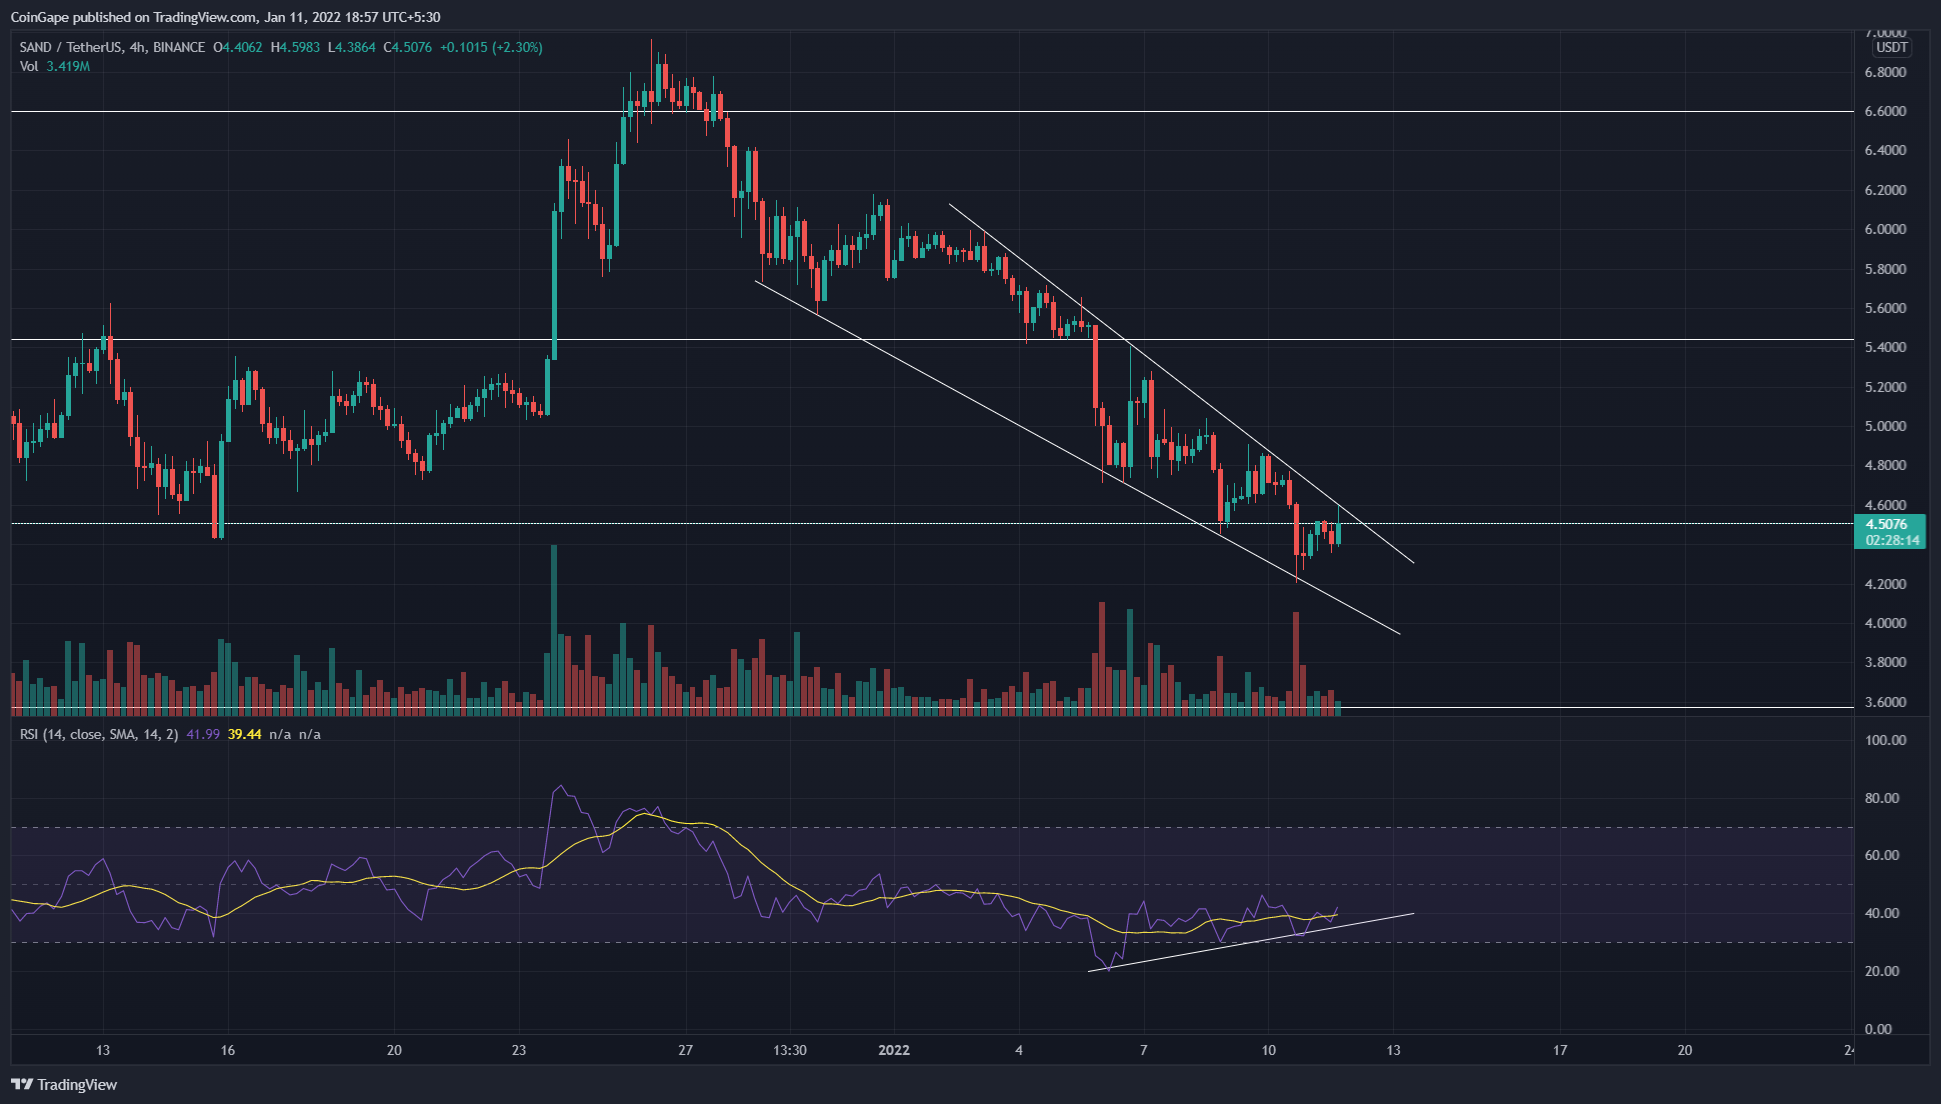
Sand Price Resonating In A Falling Channel Pattern
 Source- Tradingview
The Sandbox token is currently in a retest phase. If the price manages to sustain below this level, the coin could drop to its lower support level of $3.7. Moreover, the chart also shows a falling parallel channel pattern, leading this downfall.
Until the token is resonating inside this pattern, the price could extend the correction phase. However, this pattern is quite known for a bullish rally when the price breaks out from its overhead resistance trendline.
The Relative Strength Index(40) in the 4-hour time frame chart is steadily recovering from the oversold region. Moreover, a bullish divergence in RSI supports a bullish breakout from the falling channel.
Resistance levels: $4.61, $5.65
Support levels: $4.2, $3.5
Play 10,000+ Casino Games at BC Game with Ease
- Instant Deposits And Withdrawals
- Crypto Casino And Sports Betting
- Exclusive Bonuses And Rewards


Why Trust CoinGape
CoinGape has covered the cryptocurrency industry since 2017, aiming to provide informative insights Read more… to our readers. Our journal analysts bring years of experience in market analysis and blockchain technology to ensure factual accuracy and balanced reporting. By following our Editorial Policy, our writers verify every source, fact-check each story, rely on reputable sources, and attribute quotes and media correctly. We also follow a rigorous Review Methodology when evaluating exchanges and tools. From emerging blockchain projects and coin launches to industry events and technical developments, we cover all facets of the digital asset space with unwavering commitment to timely, relevant information.

Delivered every day.
- Insights that move markets
- 100,000 active subscribers
Related Articles


- Crypto Market Update: Top 3 Reasons Why BTC, ETH, XRP and ADA is Up
- Crypto News: Bitcoin Sell-Off Fears Rise as War Threatens Iran’s BTC Mining Operations
- U.S.–Iran War: Monday Crypto Crash Odds Rise As Pundits Predict Oil Price Spike
- US-Iran War: Reports Confirm Bombings In UAE, Bahrain and Kuwait As Crypto Market Makes Recovery
- XRP Price Dips on US-Iran Conflict, But Capitulation Signals March Rebound
- Bitcoin And XRP Price As US Kills Iran Supreme Leader- Is A Crypto Crash Ahead?
- Gold Price Prediction 2026: Analysts Expect Gold to Reach $6,300 This Year
- Circle (CRCL) Stock Price Prediction as Today is the CLARITY Act Deadline
- Analysts Predict Where XRP Price Could Close This Week – March 2026
- Top Analyst Predicts Pi Network Price Bottom, Flags Key Catalysts
- Will Ethereum Price Hold $1,900 Level After Five Weeks of $563M ETF Selling?


