Tezos Price Analysis: Symmetrical Triangle Pattern Could Lead 20% Growth In XTZ Coin


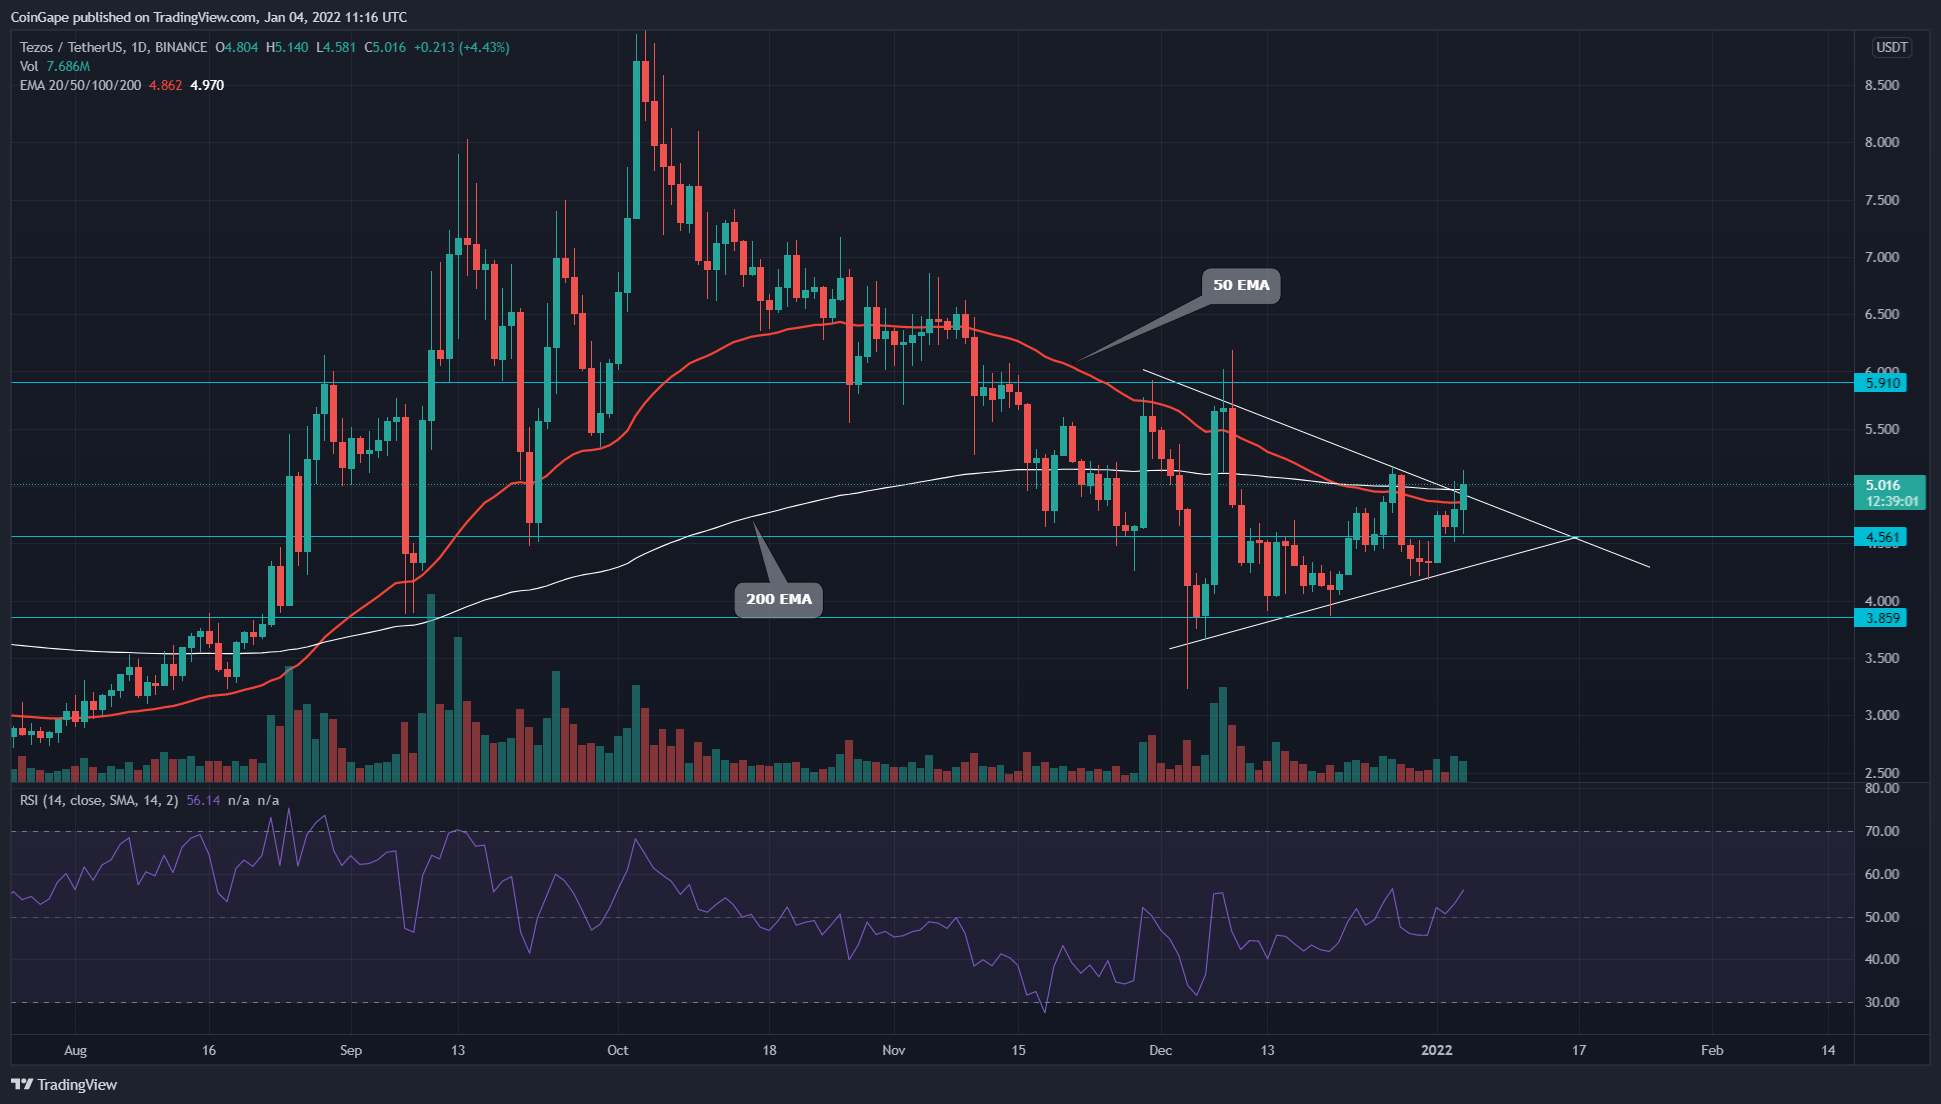
For the past month, the Tezos coin price has been moving in a consolidating rally. This sideways march revealed a symmetrical pattern in the daily time frame chart. The coin price is preparing to escape this pattern with a bullish breakout, suggesting a new rally.
Key technical points:
- The XTZ bulls are trying to reclaim the 200-EMA
- The intraday trading volume in the Tezos coin is $199.7 Million, indicating a 243.5% hike.
 Source- Tradingview
Previously when we covered an article on Tezos, the coin managed to sustain a $4.5 breakout, preparing to initiate a new rally. However, the price couldn’t hold above the 200-EMA($5.1), resulting in another minor pullback.
Anyhow, an upcoming support trendline prevents the price from dropping to $3.8 bottom support and instead reveals an excellent trading opportunity for crypto traders in the form of the symmetrical triangle pattern.
The XTZ price at press time is trading at the $5 mark, with an intraday gain of 4.27%. This daily bullish candle is trying to breach the 200-EMA line, providing an excellent edge for the long traders.
The daily Relative Strength Index (62) hops above the neutral zone(0.00), indicating a bullish sentiment for the Tezos coin.
The Support Trendline Carries The Bullish Sentiment For XTZ Investors.
 Source- Tradingview
As for now, the XTZ coin is trying to give a bullish breakout from the resistance trendline of the pattern and 200-day EMA simultaneously. However, to confirm a genuine breakout, the crypto traders should wait for a daily candle to close above these resistance levels.
However, in case the price couldn’t sustain this breakout, the long traders can still maintain a bullish sentiment until the price obtains sufficient support from the rising trendline.
The traditional pivot levels indicate the nearest resistance for Tezos coin price at the $5.1 resistance at $5.65, followed by $0.6. As for the opposite end, the support levels are $4.66 and $4.1.

Why Trust CoinGape
CoinGape has covered the cryptocurrency industry since 2017, aiming to provide informative insights Read more… to our readers. Our journal analysts bring years of experience in market analysis and blockchain technology to ensure factual accuracy and balanced reporting. By following our Editorial Policy, our writers verify every source, fact-check each story, rely on reputable sources, and attribute quotes and media correctly. We also follow a rigorous Review Methodology when evaluating exchanges and tools. From emerging blockchain projects and coin launches to industry events and technical developments, we cover all facets of the digital asset space with unwavering commitment to timely, relevant information.

Delivered every day.
- Insights that move markets
- 100,000 active subscribers
Related Articles


- Morgan Stanley, Other TradFi Load Up SOL as Solana RWA Tokenized Value Hits $1.66B ATH
- Trump’s WLFI Slides 8% as Senators Tell Bessent To Review World Liberty’s UAE Stake
- XRP Price Slides Under $1.5 Amid $50M Market Dump on Upbit
- Is Bitcoin Bottom Still Far Away as Matrixport Says More Bear Market Signals Are Emerging?
- Dalio’s Warning on World Order Sparks Fresh Bullish Outlook for Crypto Market
- XRP Price Prediction Ahead of Supreme Court Trump Tariff Ruling
- Crypto Price Prediction For This Week: Dogecoin, Solana and Cardano
- Bitcoin Price Prediction: How Could Brazil’s Strategic Bitcoin Reserve Proposal Impact BTC?
- 3 Top Reasons Pi Network Price Surging Today (14 Feb)
- XRP Price Prediction Ahead of Potential U.S. Government Shutdown Today
- Bitcoin Price Outlook As Gold And Silver Lose $3.6 Trillion in Market Value


