 Buy $GGs
Verasity Price Analysis: Reclaiming The $0.04 Mark VRA Token Hints More 28% Growth


The Verasity token shows V-top bearish reversal in its technical chart. This recent price retracement took a considerable toll on the token by losing around 63% of its value. The token price plummeted to $0.031 and currently shows recovery signs at this support.
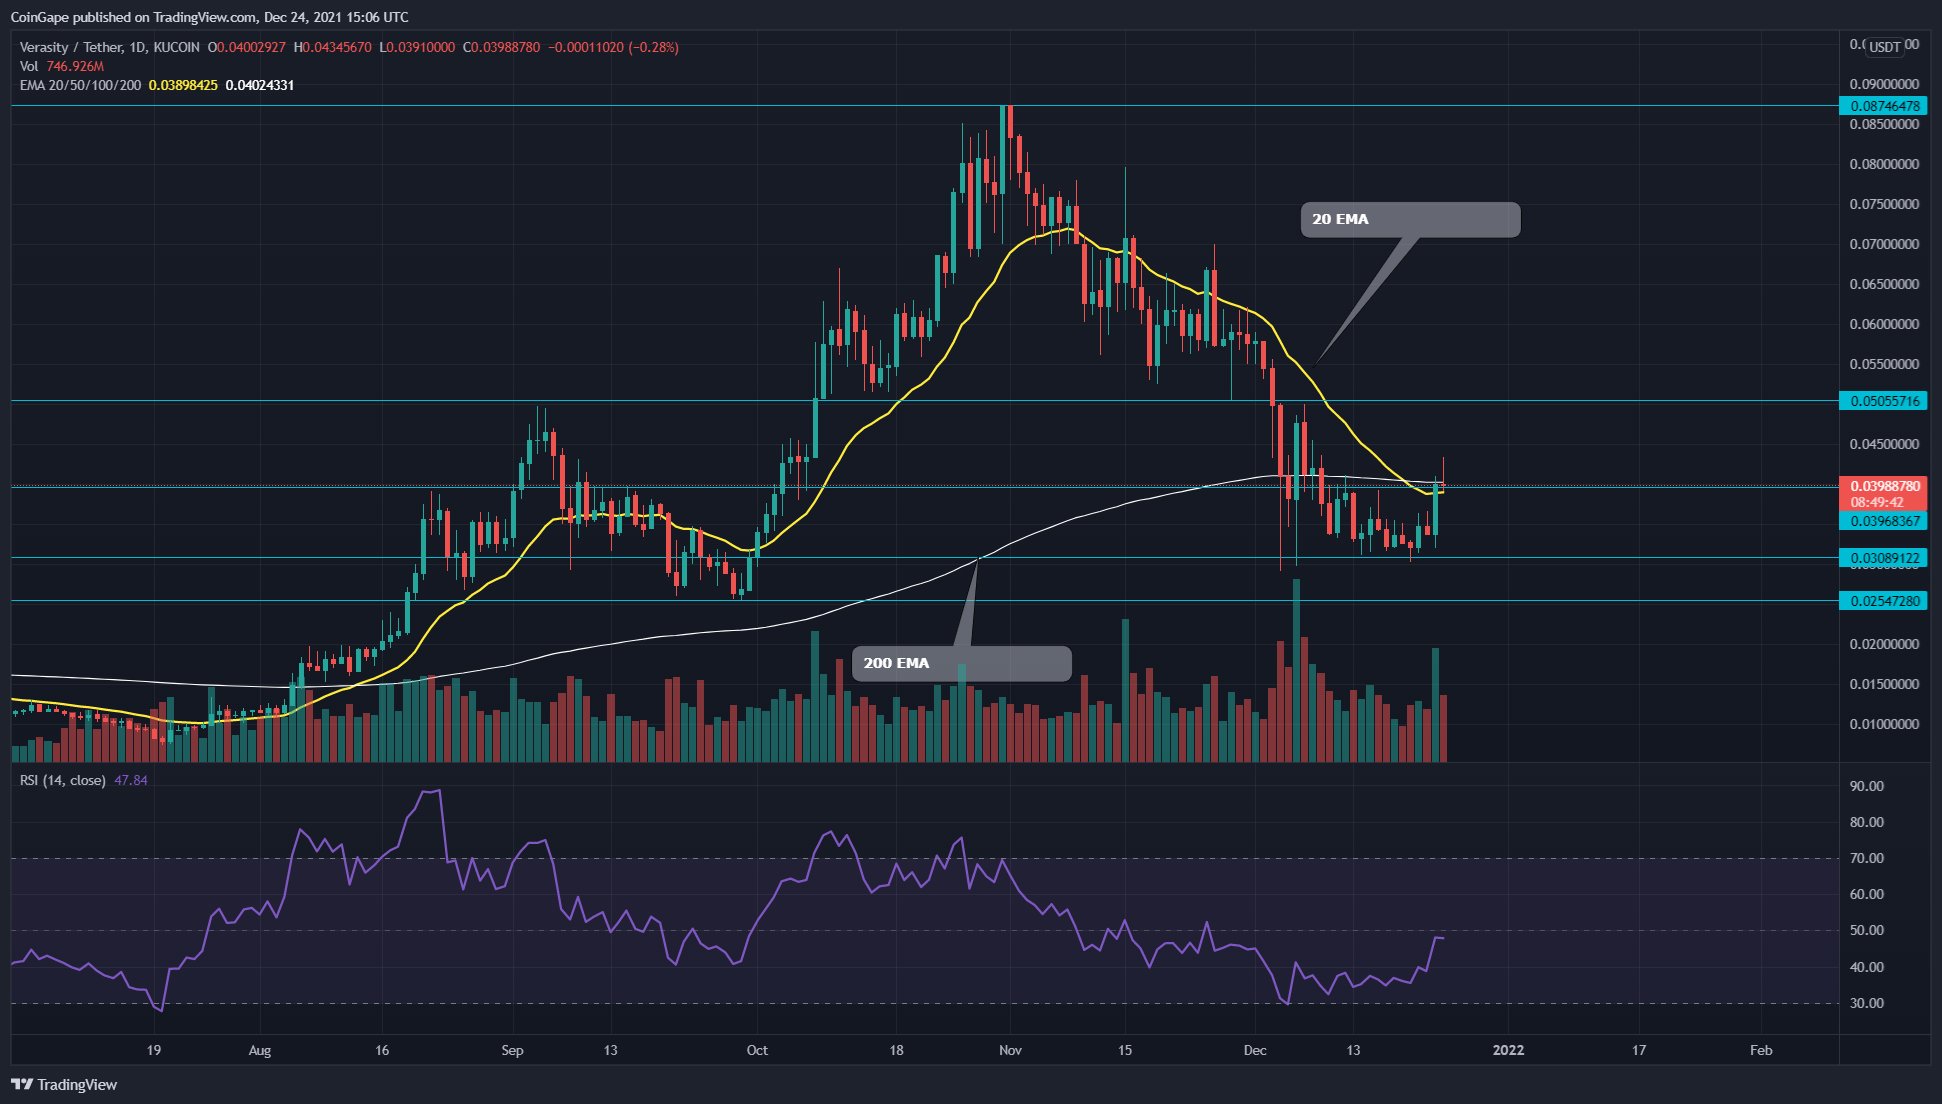
VRA/USD Daily Time Frame Chart
 Source-Tradingview
Past Performance or Trend
The Verasity token price experienced a roller-coaster ride in these last three, where the token made a huge rally of 240% in Uptomber. Still, after hitting the $0.876 mark, the token entered a correction phase and almost lost all its gain in November and December. The token price plunged to the $0.031 support and is currently obtaining strong demand near this level.
Veracity Token Attempts To Reclaim The 200-day EMA
The VRA token plummeted to the $0.031 support about a week ago, and it spent this time identifying sufficient support from this level. On December 23rd, the pair gave a huge bullish candle of $18.5% gain, trying to breach the nearest resistance level of $0.4.
The token managed to provide a daily candle closing above this level; however, the breakout was not so prominent, and therefore the traders will require more confirmation to obtain a long entry signal. Today, the price is in a retest mode and which should confirm if this breakout is genuine or not.
By press time, the VRA token is trading at $0.039, with an intraday loss of 1.7%. The 24hr volume change is $101.9 Million, indicating an 84% hike. According to the Coinmarketcap, the token stands at #382 rank with its current market cap of $182.9 Million (+5.33).
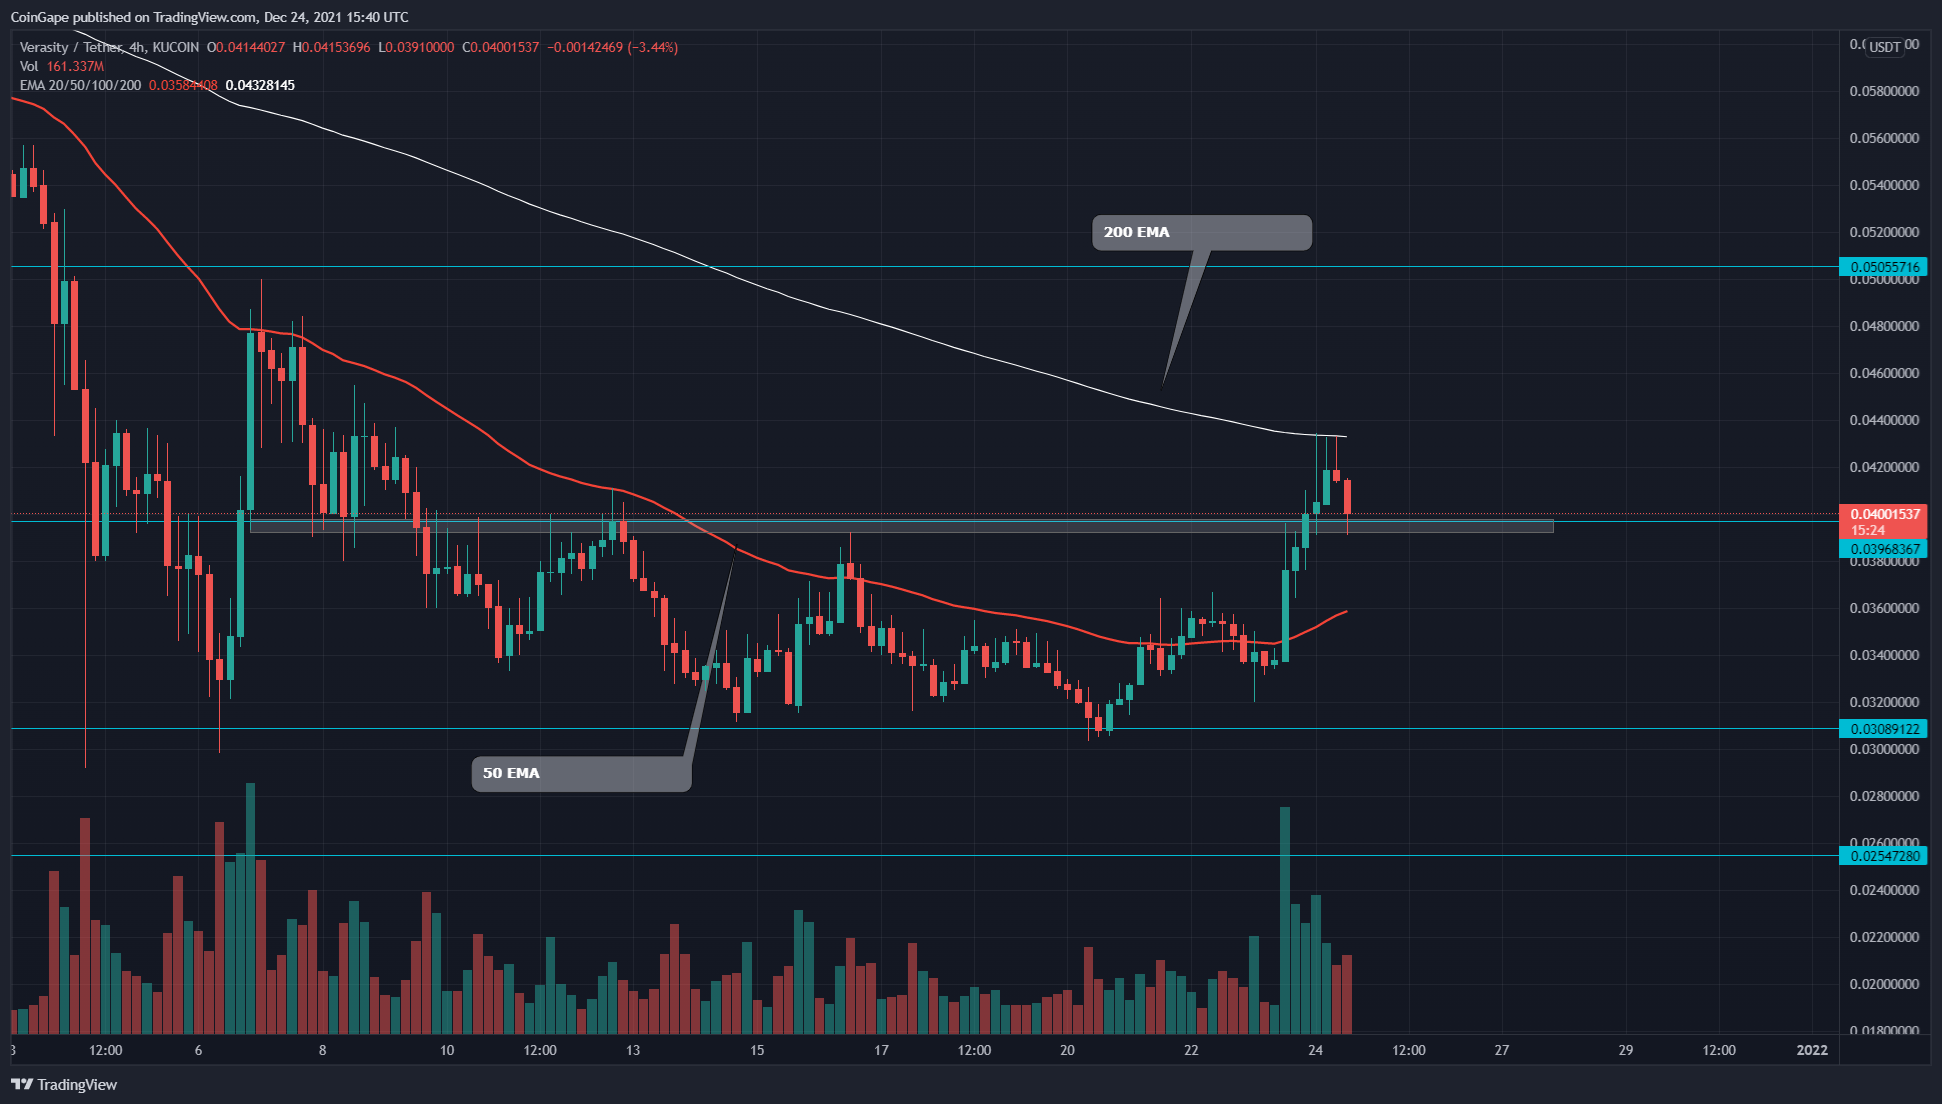
VRA/USD 4-hour Time Frame Chart
 Source-Tradingview
Technical Indicators
- -The daily Relative Strength Index(47) has started recovering similar to the price action. Moreover, the RSI line is on the verge of crossing above the neutral line(50).
- -As mentioned, the VRA token is trying to cross above the 200-day EMA line. If successful, the long traders would get an excellent edge on their side.
- -The MACD indicators in the 4-hour time frame chart show both the MACD and the signal line moving above the neutral zone, projecting a bullish momentum.
Play 10,000+ Casino Games at BC Game with Ease
- Instant Deposits And Withdrawals
- Crypto Casino And Sports Betting
- Exclusive Bonuses And Rewards


Why Trust CoinGape
CoinGape has covered the cryptocurrency industry since 2017, aiming to provide informative insights Read more… to our readers. Our journal analysts bring years of experience in market analysis and blockchain technology to ensure factual accuracy and balanced reporting. By following our Editorial Policy, our writers verify every source, fact-check each story, rely on reputable sources, and attribute quotes and media correctly. We also follow a rigorous Review Methodology when evaluating exchanges and tools. From emerging blockchain projects and coin launches to industry events and technical developments, we cover all facets of the digital asset space with unwavering commitment to timely, relevant information.

Delivered every day.
- Insights that move markets
- 100,000 active subscribers
Related Articles


- Peter Brandt Flips Bullish, Predicts Bitcoin Rally As Price Holds Above $70k
- XRP News: Institutional Use Case Expands as Doppler Finance Integrates WXRP for Multi-Chain Access
- Trump Tariffs: Bitcoin Faces Fresh Headwinds as 15% Global Tariffs Begin This Week Amid Iran War
- Bitget Unveils ‘Crypto Anti-Bias Pledge’ To Support Women’s Inclusion In Crypto
- U.S.-Iran War: Crypto Market Rebounds as Iran Reportedly Reaches Out To U.S. To End Conflict
- Dogecoin Price Outlook as BTC Recovers Above $73,000
- XRP Price Prediction as Iran-U.S. Peace Talks Trigger a Crypto Rally
- COIN Stock Analysis as Bitcoin Retests $72k Ahead of February NFP Data
- Robinhood Stock Price Prediction As Cathie Wood Buys $12M Dip in Bold ARK Move
- Bitcoin Price At Risk? Professor Who Predicted US-Iran War Says America Could Lose
- Gold Price Prediction March 2026: Rally, Crash, or Record Highs?


