Bitcoin Price Analysis: BTC Closes Above $60K For The Third Week Running


Bitcoin price turned down over the weekend as Bitcoin closes above the $60 psychological level for the third week. BTC bulls have to defend the 200-day SMA at $$56, 813 to remain bullish.
The bullish momentum slowed down for BTC bulls over the weekend as Bitcoin price turned down on the last day of ‘Uptober’. The bulls however managed to achieve a third successive weekly and the first ever monthly close above the $60,000 psychological level.
BTC/USD Weekly Chart
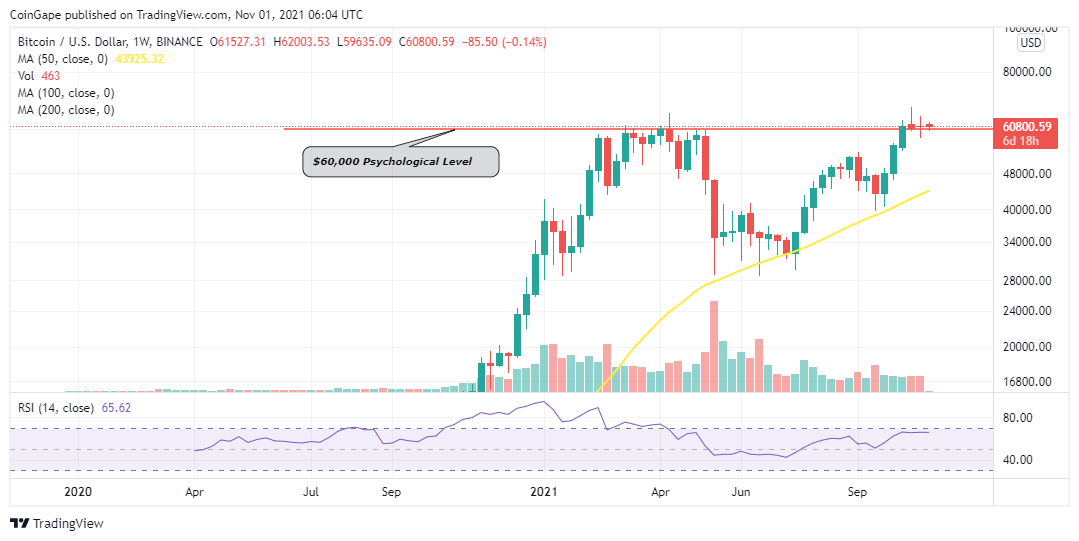
The next key level to watch is the $63,000 level where BTC has been continuously rejected after hitting the all-time high (ATH) above $67,000 on October 20.
It Has Been 13 Years!!
It is important to remember that Bitcoin was launched on January 03, 2009 at the initial price of $0.0008. The big crypto has since rallied nearly ,374,999,900% to reach the ATH around $67,000.
It has not been easy for Bitcoin hodlers as there have been some frustrating corrections and discouraging bear markets along the way as some analysts predicted doom for the pioneer cryptocurrency.
On the upside, every dip provided an opportunity for buyers to get on board as BTC scaled new heights.
Yesterday October 31, 2021 marked exactly 13 years since the Bitcoin paper was released on October 31,2008, marking the beginning of what can be possibly referred to was the biggest financial disruption in history.
The 200-day SMA Support Crucial For Bitcoin Price
Bitcoin price has spelt out a descending parallel channel on the four-hour chart with bulls struggling to push above the upper boundary resistance.
At the time of writing, BTC price is trading at $60,849 after bouncing off immediate support embraced by the middle boundary of the prevailing chart pattern around $59,411.
If Bitcoin slips below this level, BTC could drop to tag the lower boundary of the descending channel around $56, 813, coinciding with the 200-day Simple Moving Average (SMA).
This is a crucial support zone for Bitcoin bulls to defend because a drop below it could trigger massive sell orders which could see BTC/USD sink towards the $52,830 support wall.
BTC/USD Four-Hour Chart
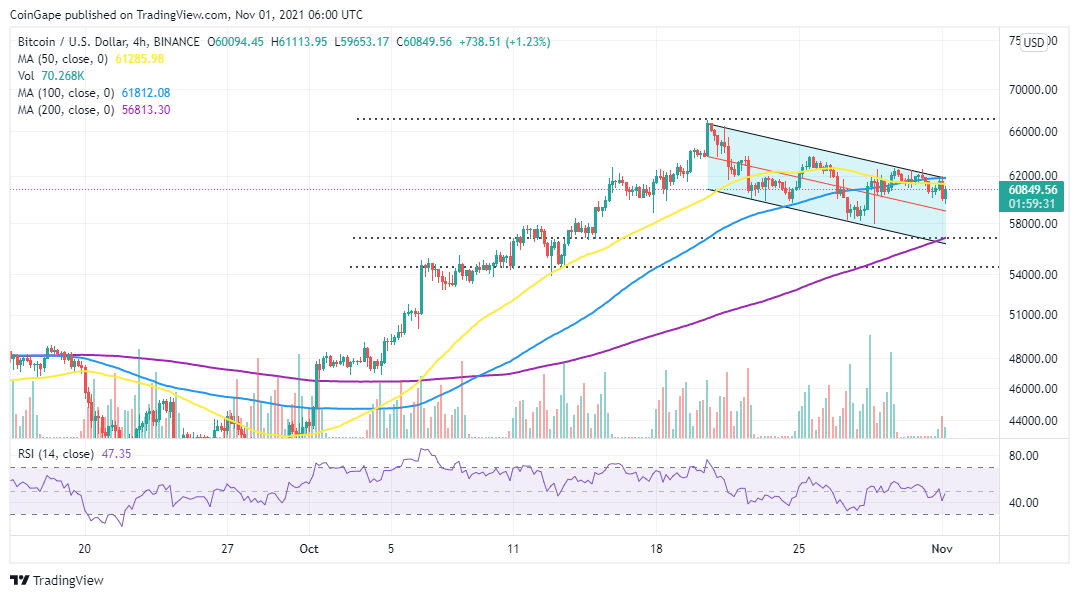
On the upside, if BTC holds onto the support provided by the middle boundary at $59,411 and closes above it, bulls will be bolstered to attempt to break above the upper boundary of the governing chart pattern.
If this happens, Bitcoin could rally to retest the ATH above $67,000 and thereafter, may be BTC could make a go at $70,000 and possibly the $100,000 mark.
Why Trust CoinGape
CoinGape has covered the cryptocurrency industry since 2017, aiming to provide informative insights Read more… to our readers. Our journal analysts bring years of experience in market analysis and blockchain technology to ensure factual accuracy and balanced reporting. By following our Editorial Policy, our writers verify every source, fact-check each story, rely on reputable sources, and attribute quotes and media correctly. We also follow a rigorous Review Methodology when evaluating exchanges and tools. From emerging blockchain projects and coin launches to industry events and technical developments, we cover all facets of the digital asset space with unwavering commitment to timely, relevant information.


Delivered every day.
- Insights that move markets
- 100,000 active subscribers
Will Bitcoin reach $250,000 by December 31, 2026?