Bitcoin Spent Output Profit Ratio Shows Bull Market Signal


There are too many Bitcoin metrics to count, but one relatively unknown one is currently flashing a big buy signal, and it has been accurate many times before.
The Bitcoin Spent Output Profit Ratio (SOPR) is a metric that determines the profit ratio of BTC moved on-chain. It is calculated from spent outputs with a realized USD value being divided by the value at the creation of the output. In other words, price sold divided by price paid.
According to on-chain analyst Renato Shirakashi, who created the SOPR, when it drops below 1, it signals that Bitcoin holders are cashing out their holdings at a loss during a market downturn. A value above 1 indicates that the owners of the spent outputs are in profit at the time of the transaction.
“First of all, SOPR appears to oscillate around the number 1. Secondly, during a bull market values of SOPR below 1 are rejected, while during a bear market values of SOPR above 1 are rejected.”
SOPR Below 1
Capriole Fund digital asset manager Jan Uytenhout has observed, using data from Glassnode that the ratio is indeed below 1 again.
Historically, when the BTC Spent Output Profit Ratio (SOPR) dipped below 1 in a bull run, it was a great time to buy. Today, it is slightly below 1 and trending up. pic.twitter.com/NwZqWR7X5o
— Jan (@uytjan) September 14, 2020
In previous instances that the SOPR dropped to these levels, large price rallies followed. He added that this assumes we are currently in a bull cycle as other indicators such as the 50 day moving average being above the 200 day also confirms.
Fellow Capriole colleague Charles Edwards posted a different metric that also signifies Bitcoin being undervalued. The Dynamic Range NVT Signal, or Bitcoin’s ‘PE Ratio’, is also low, suggesting a buy signal.
Bitcoin's "PE ratio" (DNVT) is back in the undervalued range.
Similar historic periods of Dynamic Range NVT undervaluation (and similar time spans from overvaluation) have been volatile, but in hindsight mostly for buying. pic.twitter.com/kRA8cKi2Ly
— Charles Edwards (@caprioleio) September 14, 2020
This indicator can be used to identify when Bitcoin is overbought or oversold by calculating the ratio of its market capitalization to its daily on-chain transaction value.
Bitcoin Price Update
Bitcoin prices have been ticking higher over the past day or so and have reached their highest level for twelve days according to Tradingview.com. The move has added 4.3% to BTC prices on the day as it climbed from $10,350 to top out over $10,800 a few hours ago.
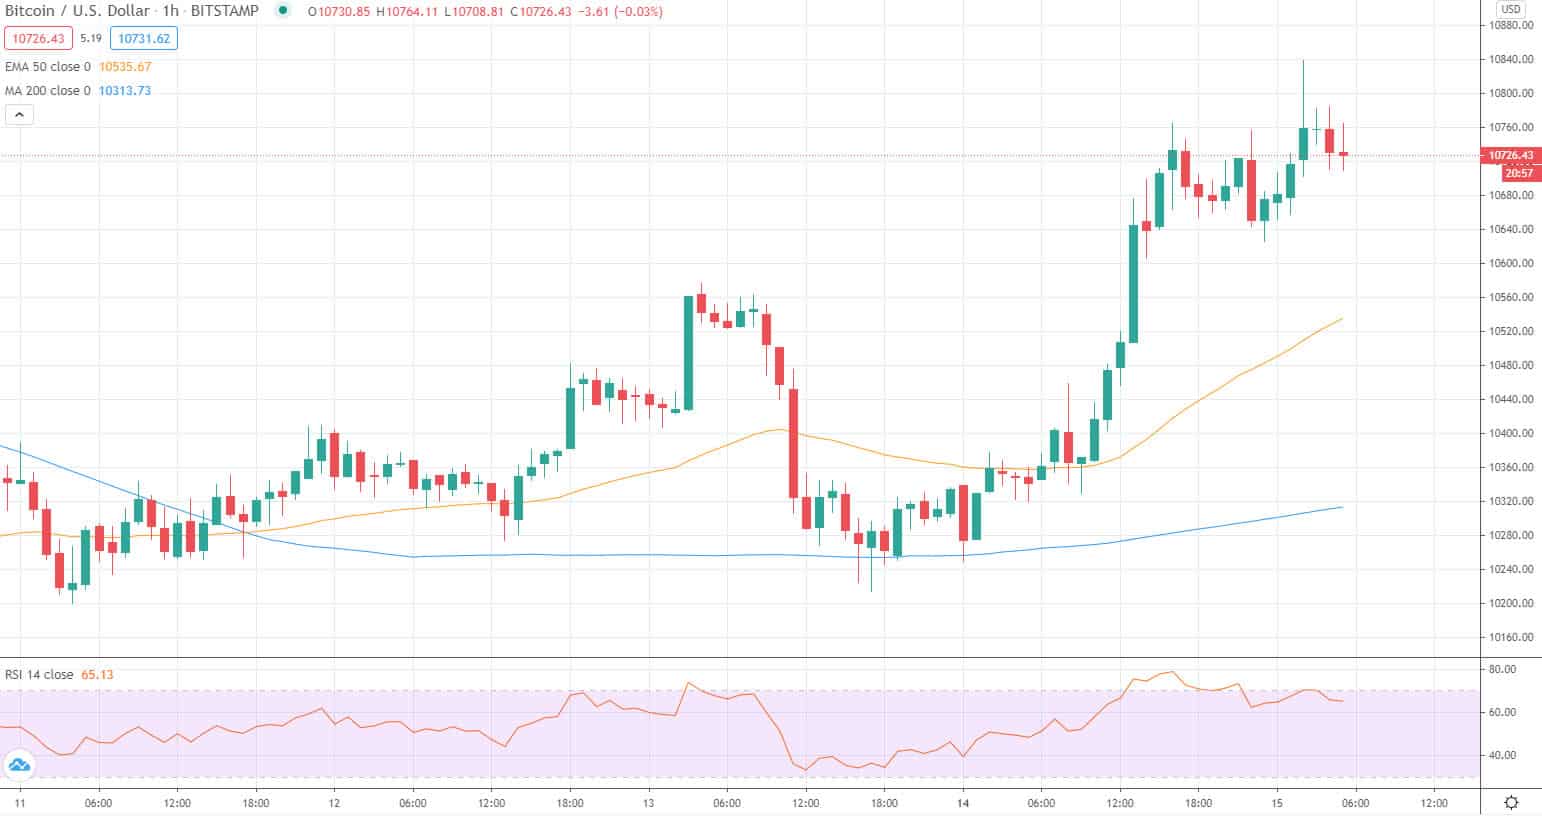
Prices have since retreated a little to the $10,750 zone but they are still the highest they have been since the sharp slump earlier this month. Analyst Josh Rager commented that two bullish weekly candle closes in a row indicates bullish momentum is still present.
Why Trust CoinGape
CoinGape has covered the cryptocurrency industry since 2017, aiming to provide informative insights Read more… to our readers. Our journal analysts bring years of experience in market analysis and blockchain technology to ensure factual accuracy and balanced reporting. By following our Editorial Policy, our writers verify every source, fact-check each story, rely on reputable sources, and attribute quotes and media correctly. We also follow a rigorous Review Methodology when evaluating exchanges and tools. From emerging blockchain projects and coin launches to industry events and technical developments, we cover all facets of the digital asset space with unwavering commitment to timely, relevant information.


Delivered every day.
- Insights that move markets
- 100,000 active subscribers
Will Bitcoin reach $250,000 by December 31, 2026?