 Buy $GGs
Chainlink Price Analysis: LINK Token Challenges The $23.5 Resistance For Bullish Breakout


After a significant correction phase, the Chainlink token managed to obtain strong support from the $17 mark. The token price started recovering where it is currently facing a crucial resistance of $23.5. With the increasing bullish momentum, the pair has reasonable possibilities to breach this overhead resistance and continue its rally.
Chainlink Key technical points:
- The LINK price flips the 20-day dynamic resistance into a possible support
- The daily RSI line charging towards the overbought zone
- The 24-hour trading volume in the Chainlink token is $1.09 Billion, indicating a 29.96% gain.
 Source-Tradingview
The retracement phase in the Chainlink token dropped the price to the strong support of $17. The pair was discounted by $51% while looking for sufficient demand pressure from the bottom support. The token price spent more than a week hovering above this level, displaying several lower price rejection candles.
On December 23rd, the token indicated a long bullish green candle, initiating a bullish reversal in the price. The current price of the token is $23.58, with an intraday gain of 2.66%
The LINK token is still trading below the trend defining 100 and 200 EMA, indicating a bearish trend in the price. However, the recent bullish reversal has recently crossed above the strong resistance of 20 EMA into a possible support level.
The daily Relative Strength Index (61) shows a striking recovery from the oversold zone. Moreover, the line is moving above the 14-EMA and has recently reclaimed the middle-neutral level(50).
LINK/USD 4-hour time frame chart
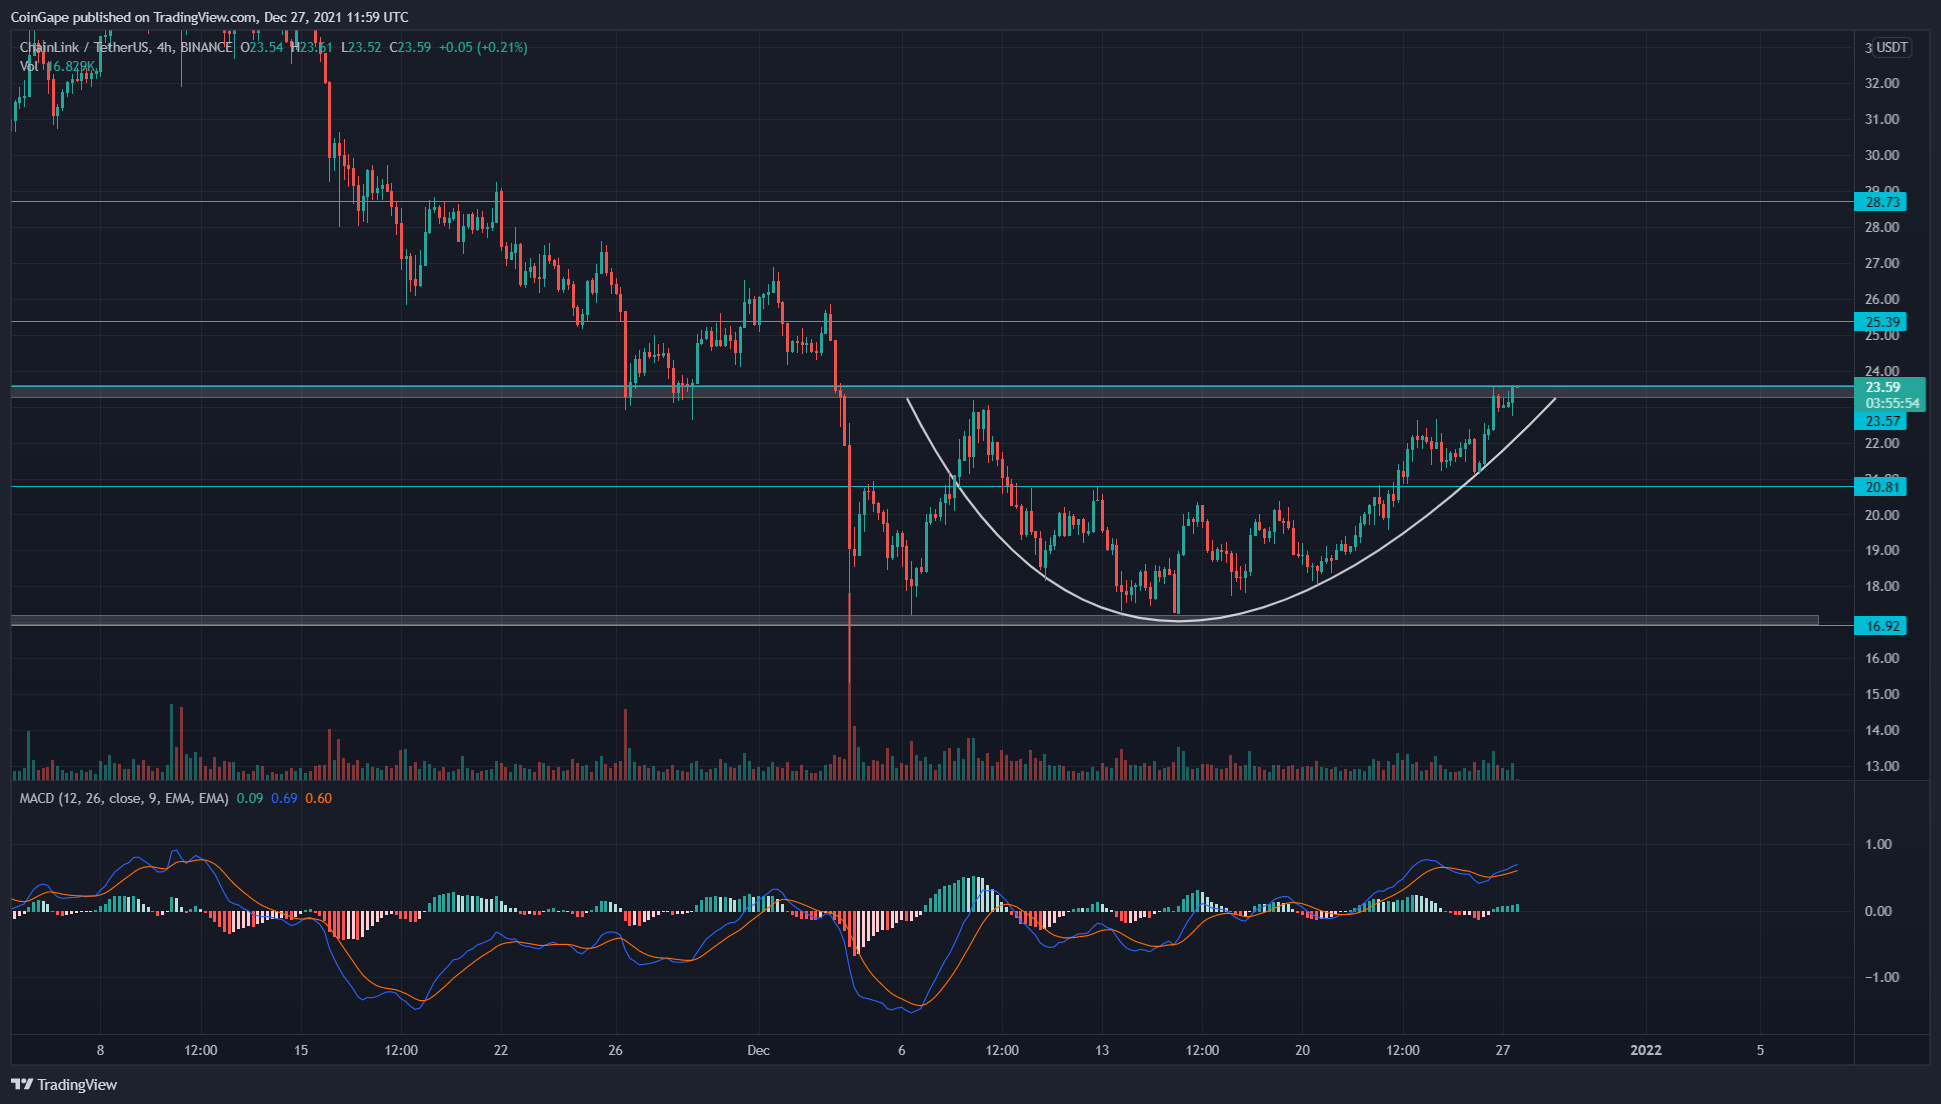 Source- Tradingview
The bullish reversal in the LINK token has formed a cup and handle pattern in this lower time frame chart. The price is currently at the doorstep of this pattern neckline, i.e., $23.5, preparing for a bullish breakout. So far, the token has surged 37.5% from the bottom support level.
The Moving average convergence divergence indicator shows a bullish crossover among the MACD and signal lines, indicating the increasing bullish momentum.
Play 10,000+ Casino Games at BC Game with Ease
- Instant Deposits And Withdrawals
- Crypto Casino And Sports Betting
- Exclusive Bonuses And Rewards


Why Trust CoinGape
CoinGape has covered the cryptocurrency industry since 2017, aiming to provide informative insights Read more… to our readers. Our journal analysts bring years of experience in market analysis and blockchain technology to ensure factual accuracy and balanced reporting. By following our Editorial Policy, our writers verify every source, fact-check each story, rely on reputable sources, and attribute quotes and media correctly. We also follow a rigorous Review Methodology when evaluating exchanges and tools. From emerging blockchain projects and coin launches to industry events and technical developments, we cover all facets of the digital asset space with unwavering commitment to timely, relevant information.

Delivered every day.
- Insights that move markets
- 100,000 active subscribers
Related Articles


- $2T Barclays Explores Blockchain to Tap Into Stablecoin and Tokenization Boom
- Breaking: U.S. PPI Inflation Rises To 2.9%, BTC Price Falls
- XRP News: Ripple-Backed Ctrl Alt Completes $280M in Diamond Tokenization on XRPL
- Bitwise CIO Calls Bitcoin Selloff ‘Classic Cycle,’ Dismisses Manipulation Rumors
- Cardone Capital Takes Real Estate On-Chain With $5B Tokenization Plan
- Top 2 Price Predictions Ethereum and Solana Ahead of March 1 Clarity Act Stablecoin Deadline
- Pi Network Price Prediction Ahead of Protocol Upgrades Deadline on March 1
- XRP Price Outlook As Jane Street Lawsuit Sparks Shift in Morning Sell-Off Trend
- Dogecoin, Cardano, and Chainlink Price Prediction As Crypto Market Rebounds
- Will Solana Price Rally to $100 If Bitcoin Reclaims $72K?
- XRP Price Eye $2 Rebound as On-Chain Data Signals Massive Whale Accumulation


