 Buy $GGs
Convex Finance Price Analysis: Here’s Why $CVX Coin May Be Heading for Another Breakout


The Convex Finance (CVX) token grows more than 50% with the breakout of the consolidation range in the daily chart. Moreover, the price action forms a bullish continuation pattern, i.e., a rising channel pattern in the 4-hour chart. Currently, a rounding bottom within this channel prepares a bullish breakout, indicating another breakout entry opportunity awaits.
Key technical points:
- The CVX token price sustains a rising channel in the 4-hour timeframe
- The 24-hour trading volume in the Convex Finance (CVX) token is $51.80 Million, indicating a 5% fall.
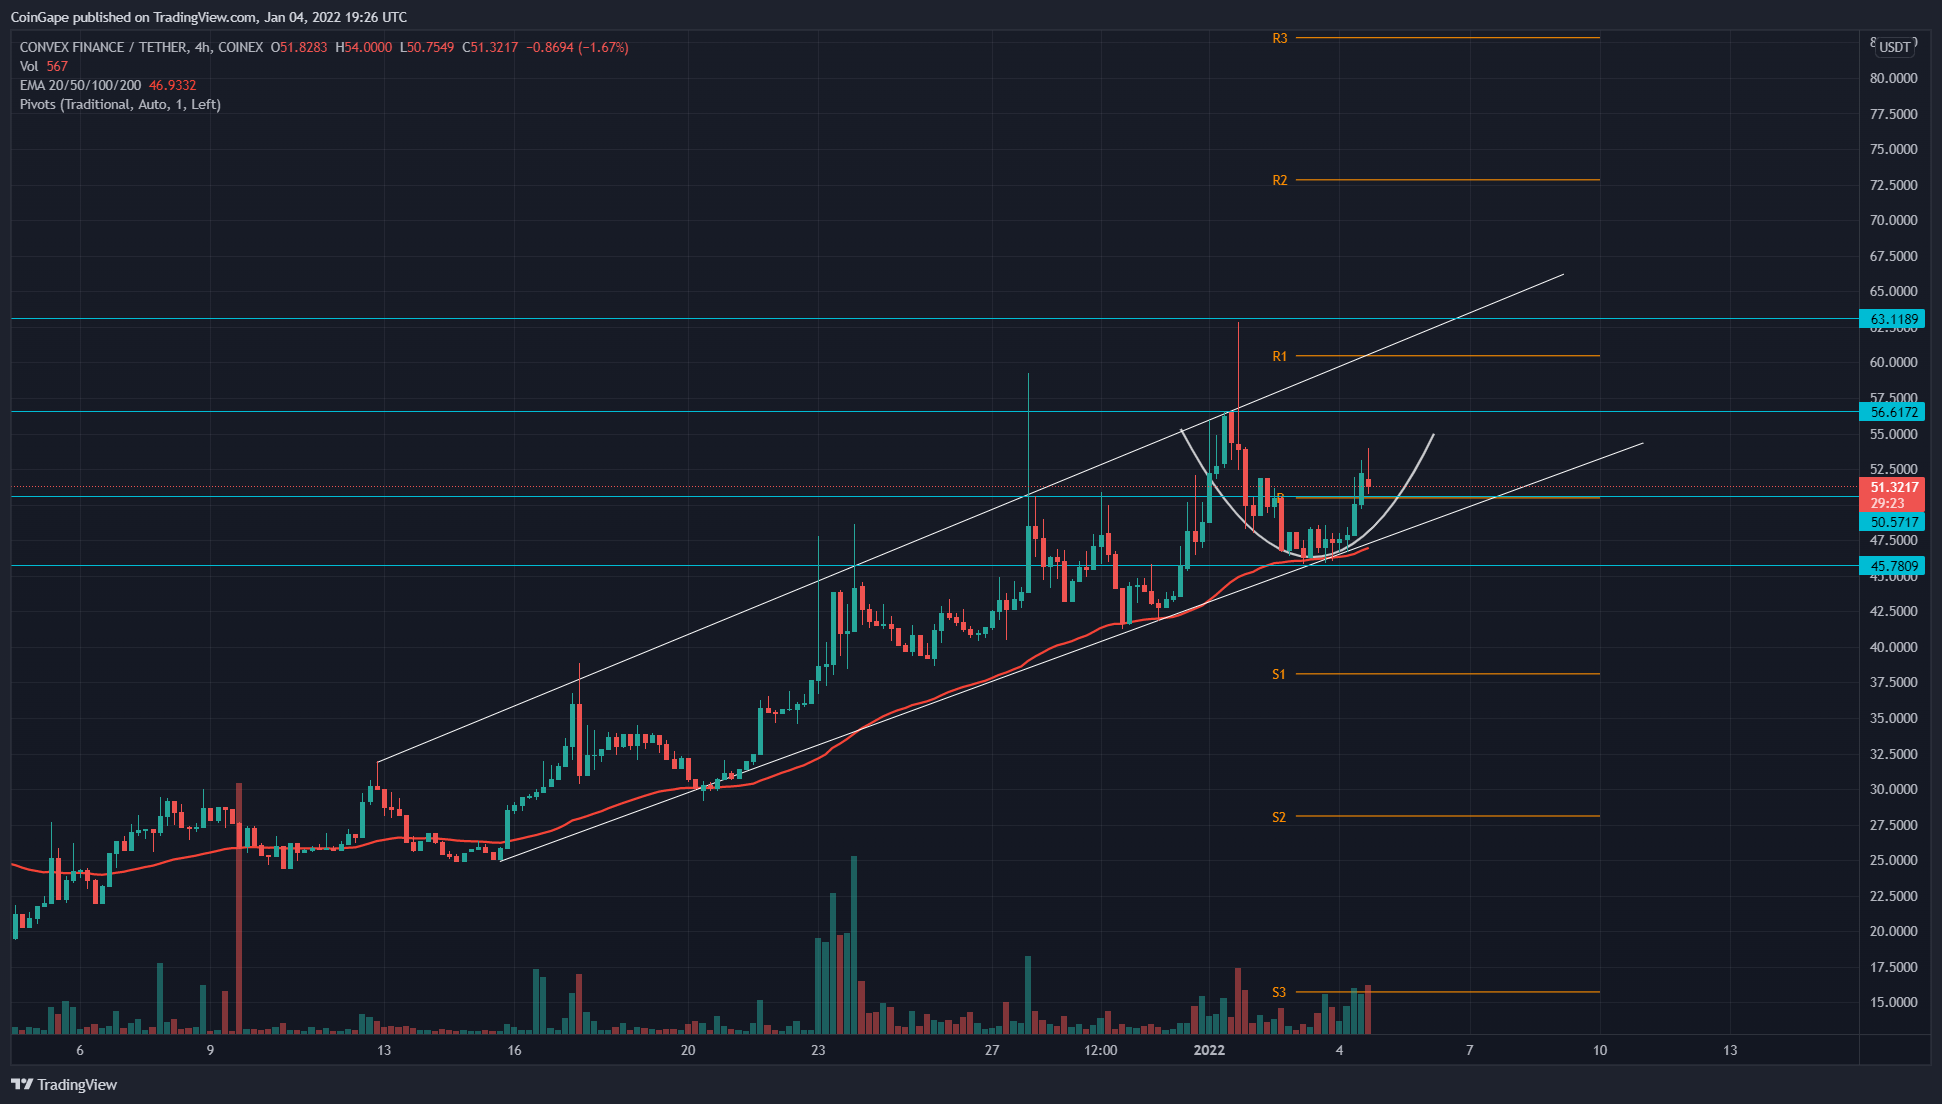 Source-Tradingview
Previously when we covered an article on the Convex Finance token, its price gave a retest of the consolidation range breakout in the daily chart. The rally forecasted after the retest has resulted in a 50% gain and a bullish continuation pattern in a shorter time frame.
The post-breakout uptrend leads to a rising channel pattern in the 4-hour chart, with price recovering from the recent dip to the support trendline. Moreover, the price action within the channel forms a rounding bottom pattern with the neckline at the $56 mark.
The fewer number of dips to support the trendline in comparison to the bullish attempts to break above the channel indicates massive growth in buying pressure. Therefore, the breakout above the $56 mark can result in a price jump to the $73 mark.
The daily Relative Strength Index (67) struggles to rise into the overbought zone as it shows zig-zag move near the overbought boundary. Additionally, the price finds constant support from the 50-period EMA in the 4-hour chart that has pushed every bearish attack in the rising channel.
CVX token Sustains Bullish Momentum Above Consolidation Breakout
 Source- Tradingview
The breakout of the consolidation range between the $39 and $18.5 mark initiated a new uptrend in this CRV token. The coin price gradually rises with multiple three rising method patterns in the daily chart. The traditional pivot levels suggest the price can expect the next supply zones near the $73(R2) and 82(R3) mark.
The technical chart indicates the important chart levels are:
- Resistance- $56.4 and $62.8
- Support levels- $50.6 and $4
Play 10,000+ Casino Games at BC Game with Ease
- Instant Deposits And Withdrawals
- Crypto Casino And Sports Betting
- Exclusive Bonuses And Rewards


Why Trust CoinGape
CoinGape has covered the cryptocurrency industry since 2017, aiming to provide informative insights Read more… to our readers. Our journal analysts bring years of experience in market analysis and blockchain technology to ensure factual accuracy and balanced reporting. By following our Editorial Policy, our writers verify every source, fact-check each story, rely on reputable sources, and attribute quotes and media correctly. We also follow a rigorous Review Methodology when evaluating exchanges and tools. From emerging blockchain projects and coin launches to industry events and technical developments, we cover all facets of the digital asset space with unwavering commitment to timely, relevant information.

Delivered every day.
- Insights that move markets
- 100,000 active subscribers
Related Articles


- Crypto Market on Edge as US-Iran Hold Talks Ahead of Trump’s War Deadline
- XRP Prepares for Phase 4 Lift-Off, $21.5 Level in Focus
- Vitalik Buterin Exceeds Planned Ethereum Sales as Total Liquidations Hit $35M
- Circle Stock Price Jumps 35% to $83 on Stablecoin Boom, USDC Supply Soars 72%
- Democrats Convene US Senate Crypto Bill Meeting as a16z Briefs Republicans on CLARITY Act & AI
- XRP Price Outlook As Jane Street Lawsuit Sparks Shift in Morning Sell-Off Trend
- Dogecoin, Cardano, and Chainlink Price Prediction As Crypto Market Rebounds
- Will Solana Price Rally to $100 If Bitcoin Reclaims $72K?
- XRP Price Eye $2 Rebound as On-Chain Data Signals Massive Whale Accumulation
- Ethereum Price Reclaims $2K- New Rally Ahead or a Temporary Bounce?
- COIN Stock Price Prediction as Wall Street Pros Forecast a 62% Surge


