Fantom (FTM) Price Analysis: Old Resistance Turns Support with a Double Bottom Pattern on 4 Hr Chart


As the crypto market makes a steady recovery from the recent correction in total market cap, Fantom sees a meteoric surge in its DeFi and NFT marketplace adoption and moving from eight to fourth-largest blockchain by DeFi TVL-Total Value Locked.
Both Fantom’s FTM token and Yearn Finance YFI have recorded good gains following the expansion of Yearn Finance vaults now on the Fantom Network, with the FTM token being the winner in the YFI multi-chain expansion.
The Yearn Finance expansion to the Fantom ecosystem was successful owing to Fantom’s ease of bridge, ease of use, and speed. Also, Andre Cronje, the founder of Yearn Finance recently started a text-based RPG project called Rarity on the Fantom ecosystem.
Let’s dive into the charts.
Fantom (FTM) Weekly Chart Analysis
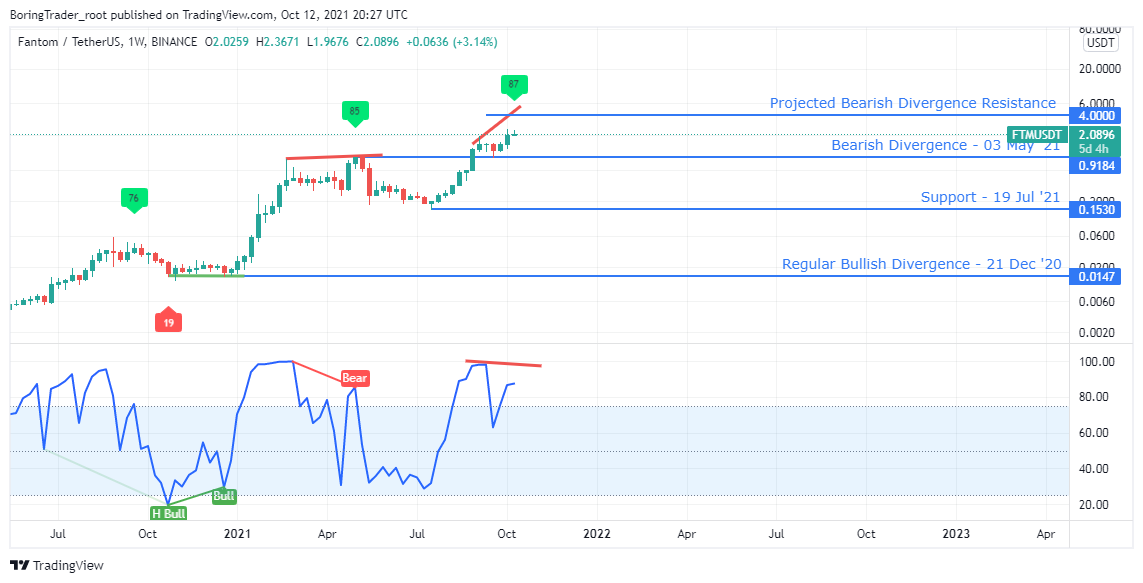
The FTMUSDT went parabolic after finding a price floor at 0.1530, with the RSI trading above level-25 and level-75 at press time.
Bullish momentum used the old 0.9184 resistance as support and gets set to send the FTM price to the $4.00 round-number resistance where it may later signal a regular bearish divergence.
As the bears wait patiently and look to short-sell the market, the bulls look to squeeze more out of the upbeat momentum into new price discovery zones. Let’s check out the daily time frame.
Fantom (FTM) Daily Chart Analysis
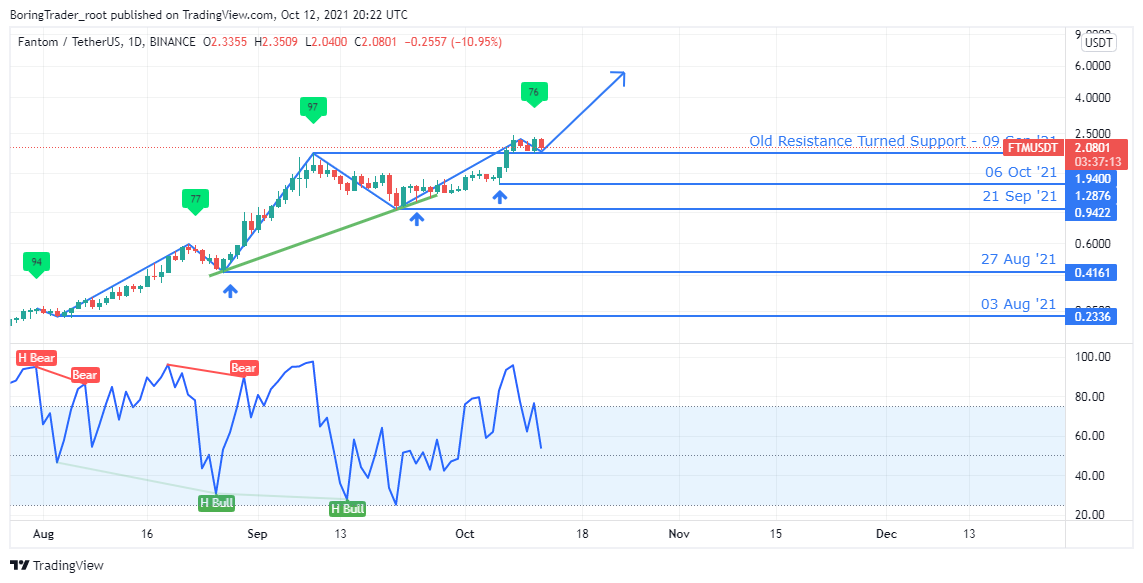
Rising peaks and troughs on the daily time frame are identified with the RSI hovering above level-25 and confirms a break above previous peaks by shooting beyond level-75.
Following a break above 09 September resistance, the bulls now suggest flipping the old resistance into new support forming consecutive bullish closing candlesticks.
However, traders should be mindful of the RSI at level-76, a figure that is less than the previous peak’s level-97, which hints at the bearish sentiment.
We may decide to lock in some gains if the RSI value skyrocket beyond level-90.
Fantom (FTM) 4 hr Chart Analysis
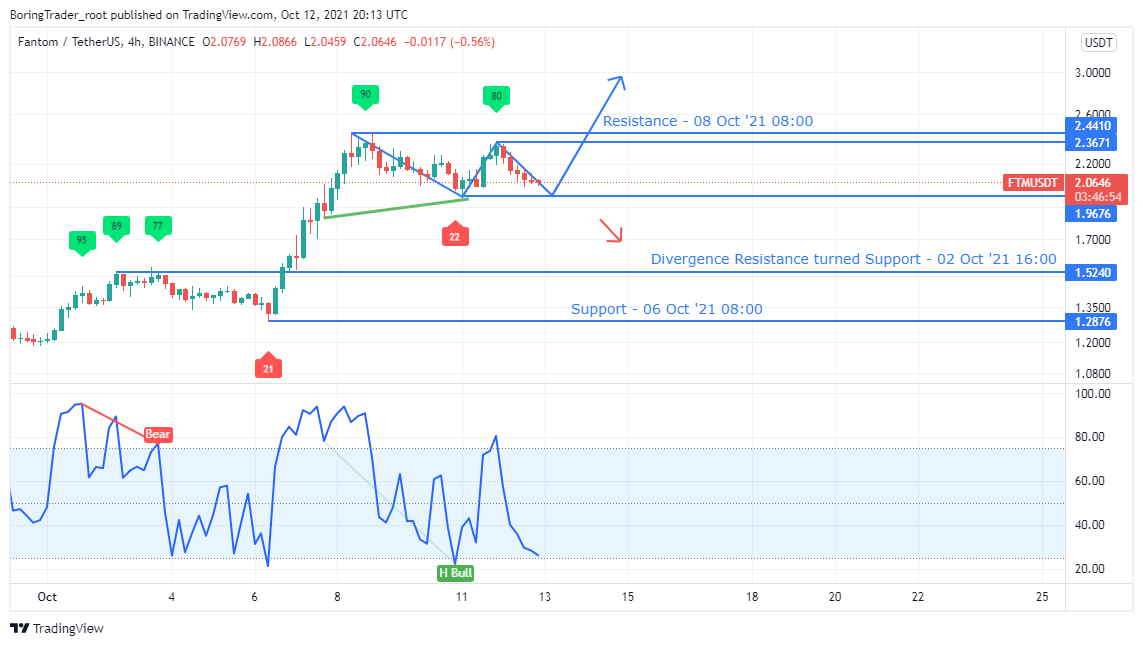
Lastly, a view from the 4HR intraday charts reveals a slowing uptrend, where a collapse below 1.9676 support would show the further weakness of the long-term bullish campaign.
However, short-term bullish position traders could go long on the FTMUSDT in anticipation that the bullish divergence support [1.9676] would mark an end to the short-term correction phase.
- Bullish and Bearish Scenarios
Following the multi-timeframe analysis so far, the weekly time frame shows that long-only traders/investors should be cautious at the current price levels.
Meanwhile, the short-term intraday charts show mixed sentiment with possibilities of a double bottom price action at support [1.9676] followed by a short-term uptrend.
Fantom FTM Intraday Levels
- Spot rate: 2.097
- Mid–Term Trend [H4]: Bullish
- Volatility: High
- Support: $1.9676, $1.5240, $1.2876
- Resistance: $2.3671, $2.4410
Why Trust CoinGape
CoinGape has covered the cryptocurrency industry since 2017, aiming to provide informative insights Read more… to our readers. Our journal analysts bring years of experience in market analysis and blockchain technology to ensure factual accuracy and balanced reporting. By following our Editorial Policy, our writers verify every source, fact-check each story, rely on reputable sources, and attribute quotes and media correctly. We also follow a rigorous Review Methodology when evaluating exchanges and tools. From emerging blockchain projects and coin launches to industry events and technical developments, we cover all facets of the digital asset space with unwavering commitment to timely, relevant information.


Delivered every day.
- Insights that move markets
- 100,000 active subscribers