Cryptocurrency Price Today: MANA, SAND And AXS Price Shows Recovery Signs As Metaverse ETFs Gain Popularity


Despite a bearish sentiment spread across the whole crypto-verse. The Meta-industry has seen some great fundamental perks as more established companies are entering the metaverse. Moreover, due to the recent bloodbath, inventors can grab discounted offers in these metaverse tokens providing enormous growth potential.
MANA Bulls Challenge Major Technical Resistances For Bullish Breakout
 Source-Tradingview
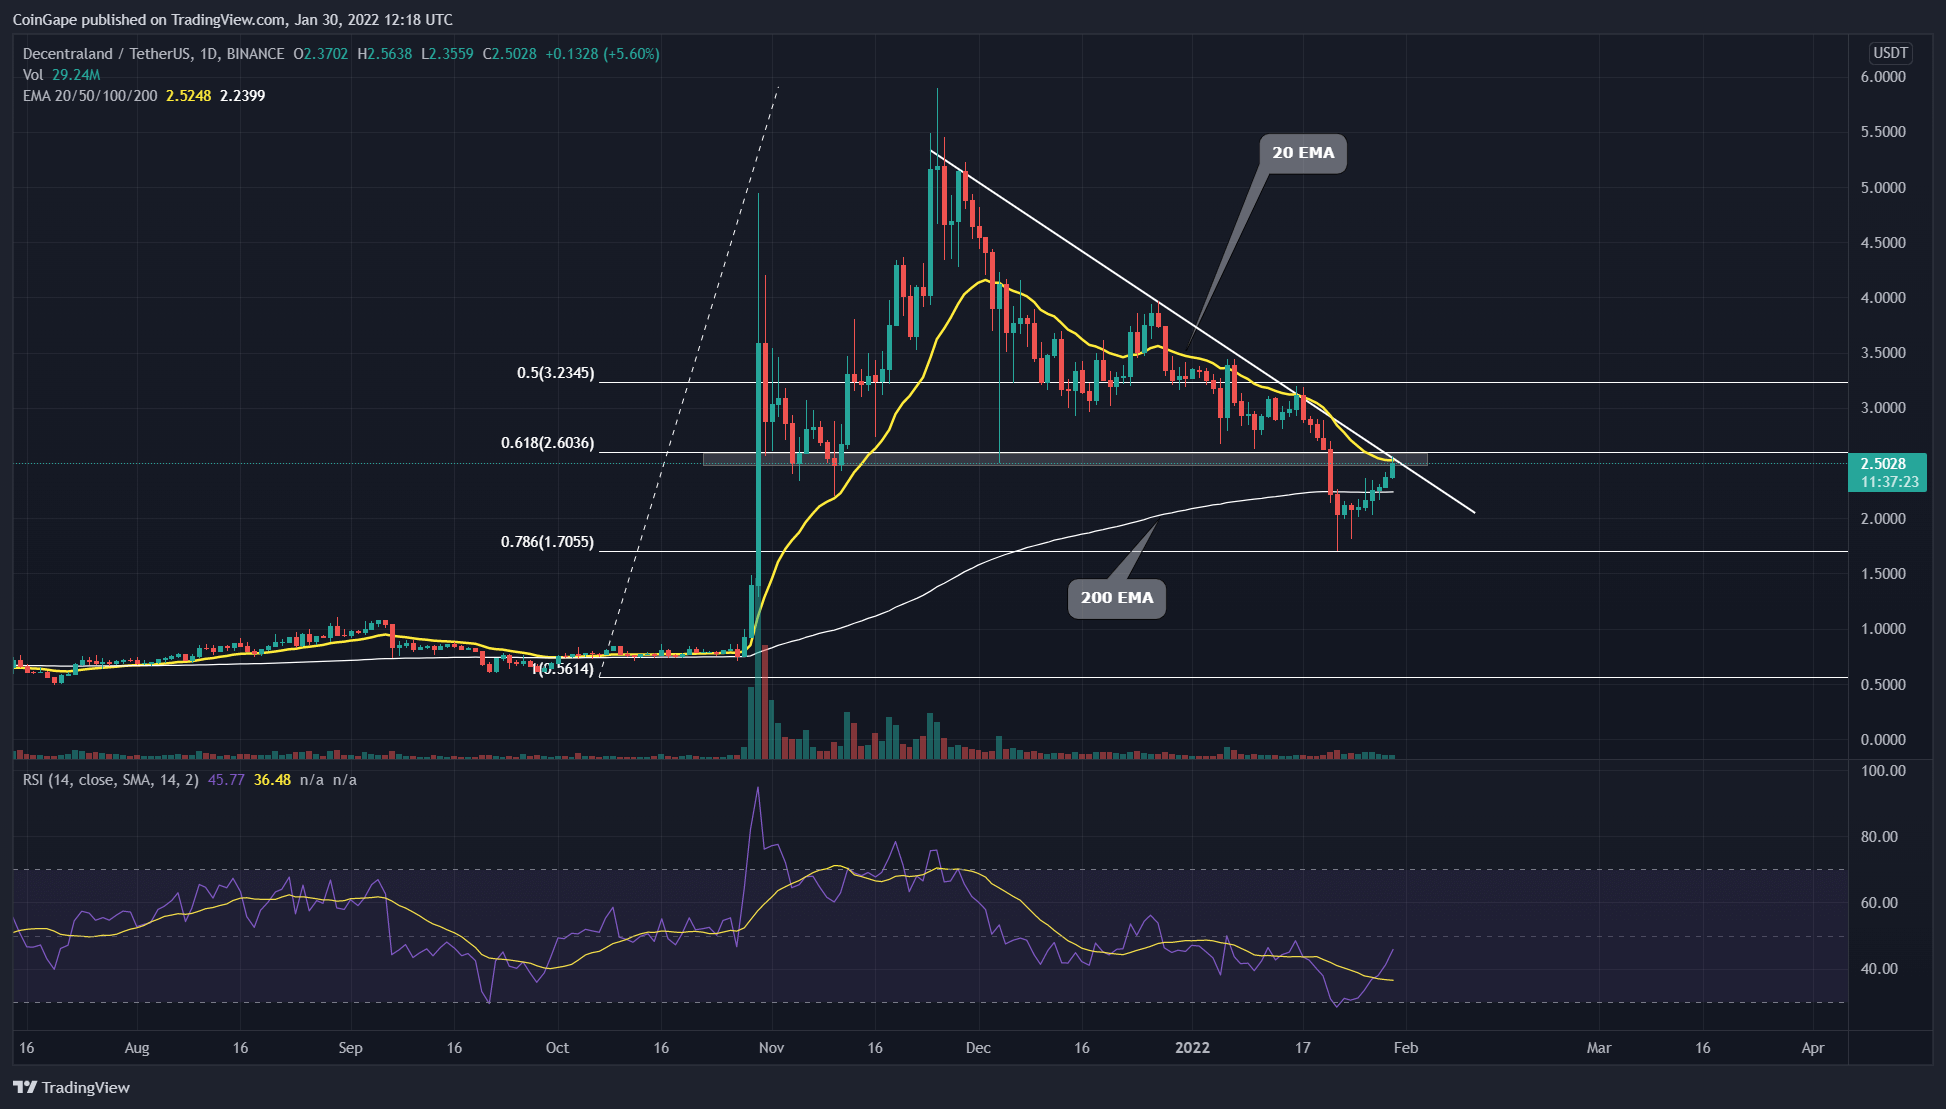
The correction phase initiated during late November 2021 had tumbled the MANA/USD pair by 70% while dropping it to 0.789 Fibonacci retracement level. The MANA price has rebounded from the bottom support($1.75) due to strong demand pressure.
- The V-shaped recovery in MANA registered a 40% gain, pumping the token price to $2.51. The price action will soon challenge a shared resistance of 20-day EMA, 0.5 FIB level, and the long coming resistance trendline, indicating an ultimate test for bulls.
- A breakout or rejection from the overhead resistance would confirm the upcoming rally in MANA.
- The Relative strength index(46) shows a parabolic rally approaching the neutral zone(0.00), which projects the growing bullish momentum.
SAND/USD Chart Shows Rounding Bottom Pattern
 Source- Tradingview
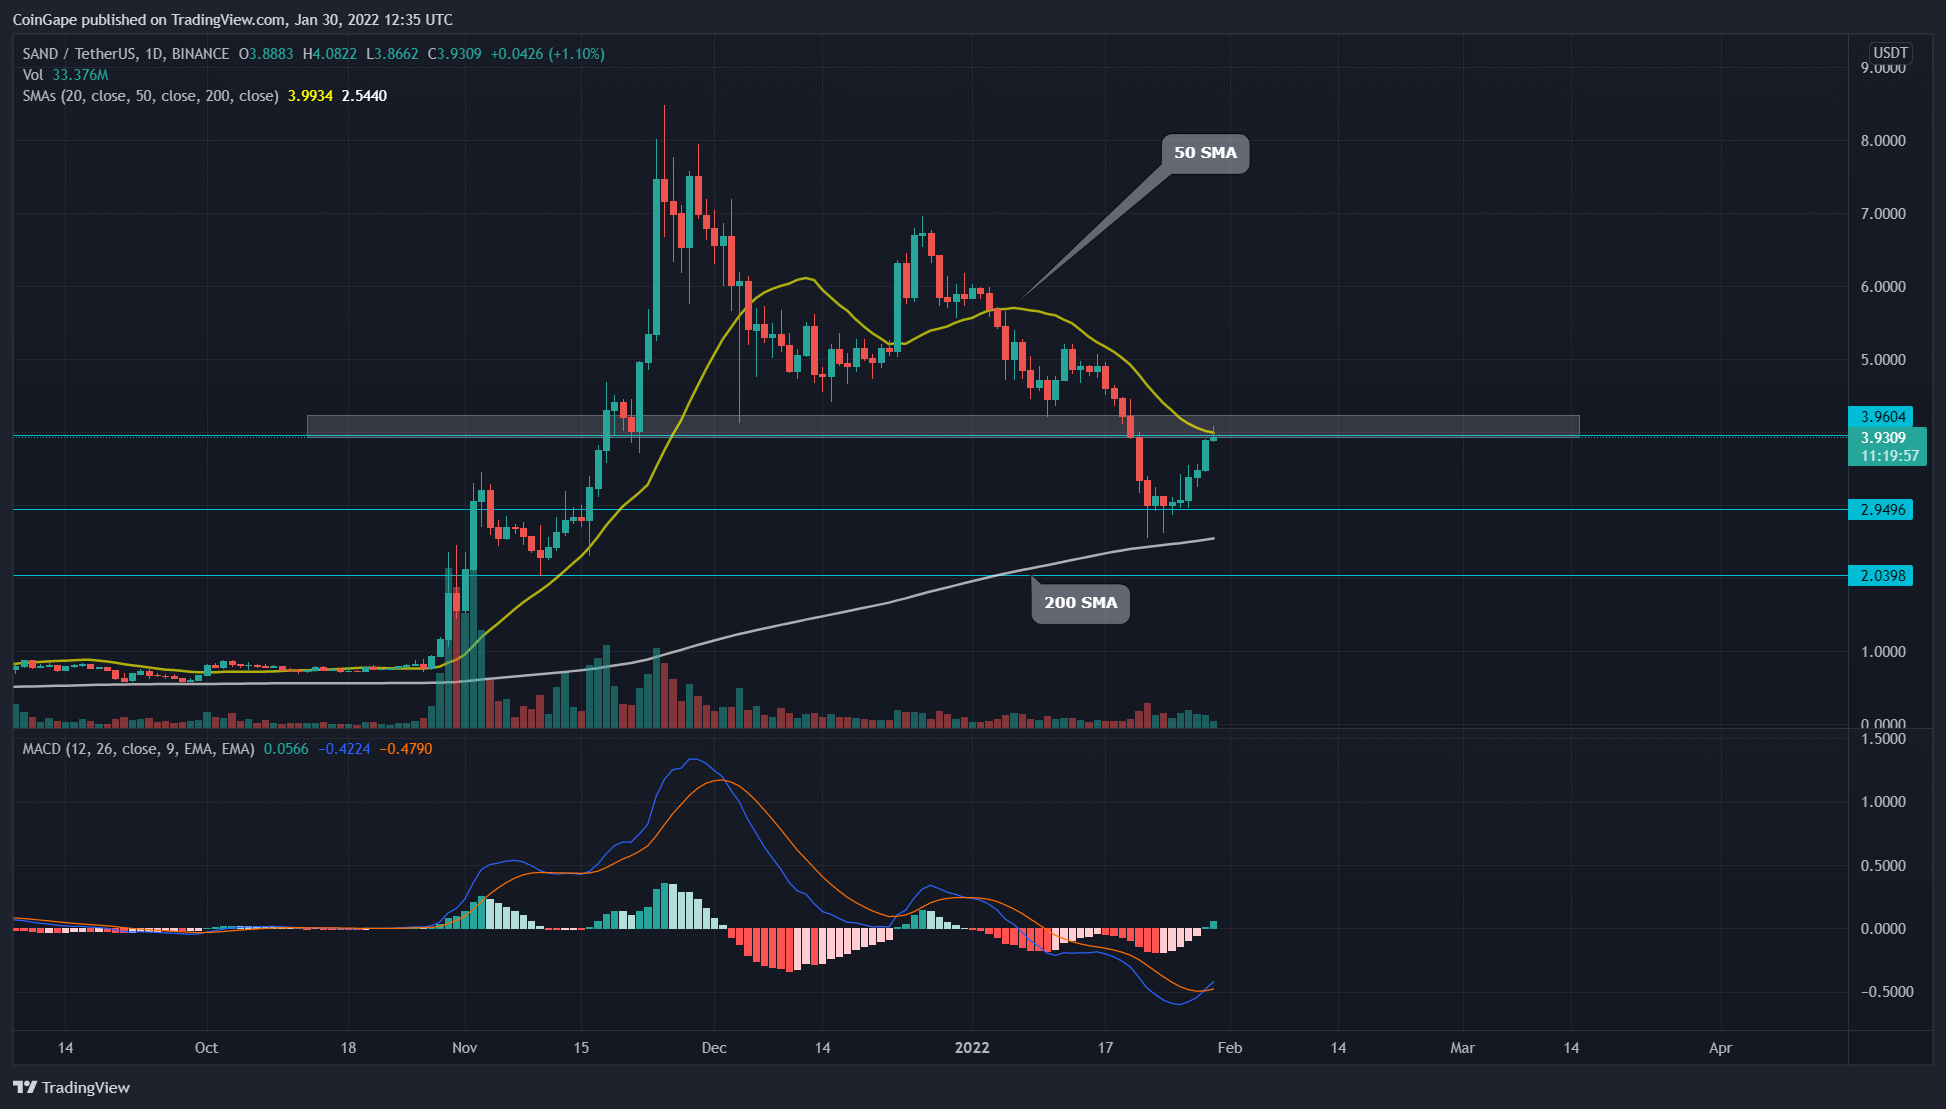
The recent lower low($2.59) in SAND price shows a 65% fall from the All-Time High of $8.48. The bulls managed to defend the 200-day EMA support, indicating the overall trend is still bullish.
- A recovery rally initiated this week has gained 50% as the price currently trades at $3.93. The price action is at the doorstep of a combined resistance of $4 and 20 SMA, preparing for a bullish breakout.
- Moreover, the token chart shows a rounding bottom pattern in the 4-hour time frame, suggesting a better probability for a $4 breakout.
- The moving average convergence/divergence shows a bullish crossover of the MACD and signals line, providing additional confirmation for a recovery rally.
AXS Price Extends Correction Phase In Falling Channel Pattern
 Source- Tradingview
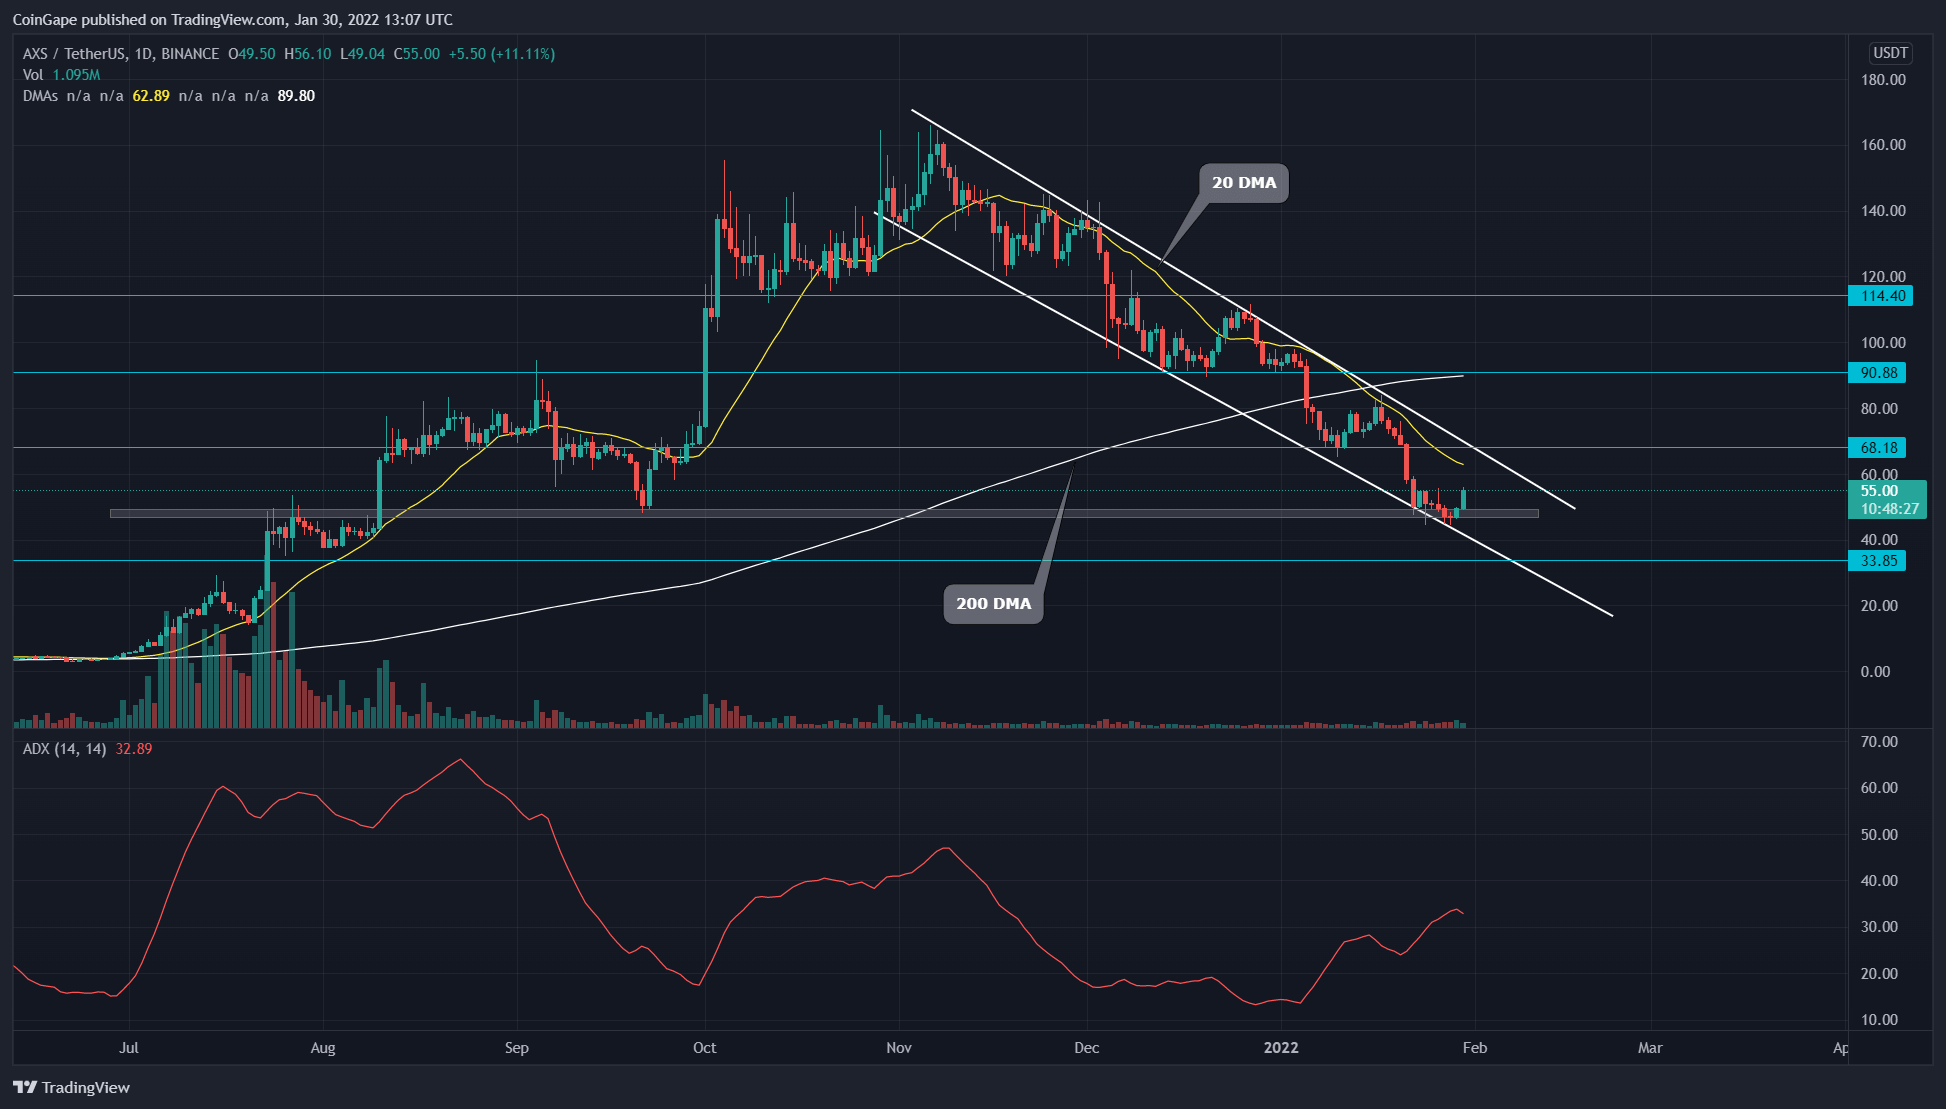
The AXS/USD technical chart shows a falling parallel channel pattern in the daily time frame chart. The price action respecting this pattern has lost 72% from the All-Time High of $165.6 by sliding to the $46.6 mark.
- The sellers marked a new lower low($46.6) at the support trendline, triggering a bullish pullback to the overhead resistance. Thus, until this pattern is intact the AXS price will remain in a bearish trend.
- On a contrary note, the bullish breakout from this falling channel could provide an excellent long opportunity to buyers.
- The ADX(32.8%) slope rallying higher indicates the increasing bearish momentum.
Why Trust CoinGape
CoinGape has covered the cryptocurrency industry since 2017, aiming to provide informative insights Read more…to our readers. Our journal analysts bring years of experience in market analysis and blockchain technology to ensure factual accuracy and balanced reporting. By following our Editorial Policy, our writers verify every source, fact-check each story, rely on reputable sources, and attribute quotes and media correctly. We also follow a rigorous Review Methodology when evaluating exchanges and tools. From emerging blockchain projects and coin launches to industry events and technical developments, we cover all facets of the digital asset space with unwavering commitment to timely, relevant information.


Will Bitcoin reach $250,000 by December 31, 2026?