MANA Price Analysis: Escaping This Flag pattern MANA Token Could Rally To $5.5 Mark







A Flag pattern is leading this correction rally in Decentraland (MANA) token price. The token is still trapped inside this pattern, and so far it has almost lost 50% of its value. The long traders should wait for a bullish breakout from the overhead trendline to acquire a proper long entry signal.
Key technical points:
- 100-day EMA provides strong support to MANA token
- The ADX slope has shown a significant drop in its value
- The 24-hour trading volume in the Decentraland token is $344.9 Million, indicating a 13.9% loss
 Source-Tradingview
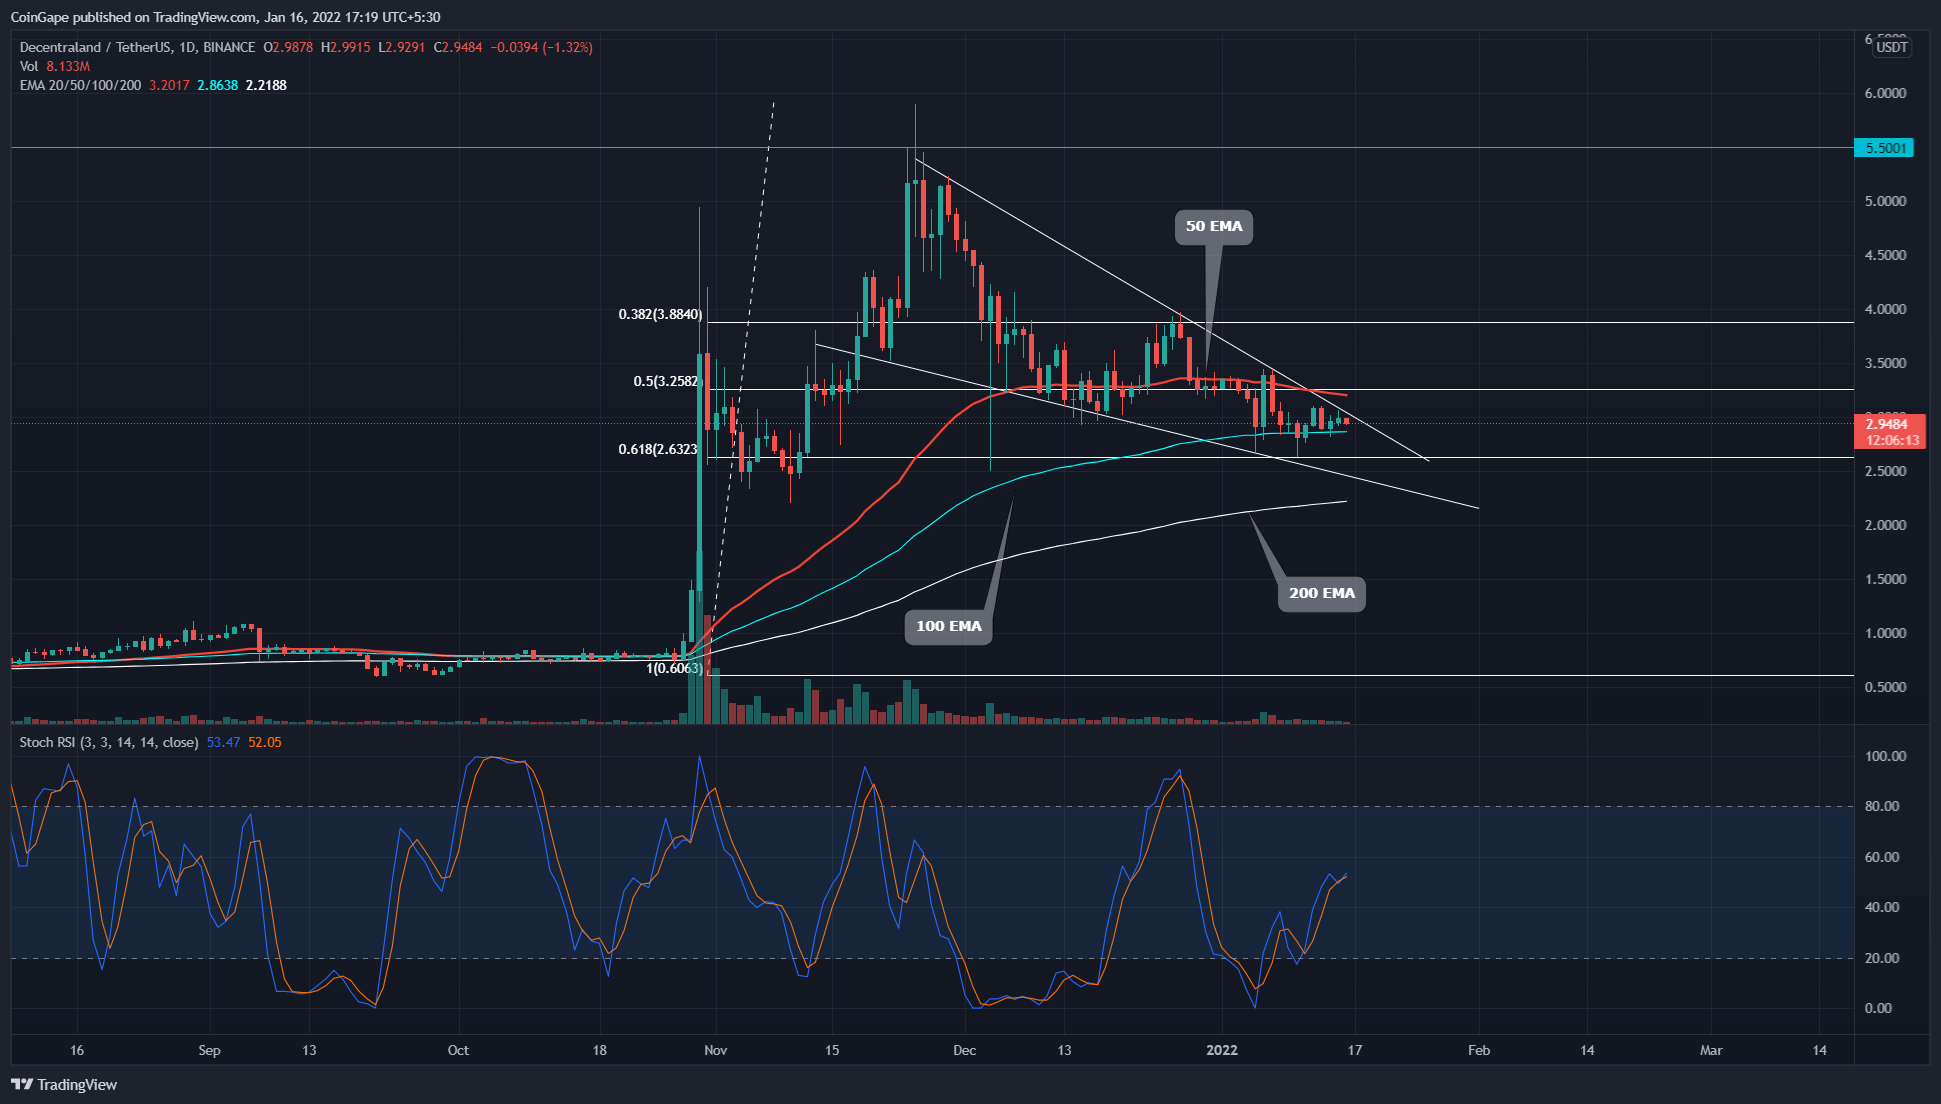
Previously when we covered an article on Decentraland token price analysis, the MANA/USD price was trying to recover from the January 5th bloodbath in the crypto market. However, the buyers couldn’t sustain the price at a higher level and dropped it back to the 0.168 Fibonacci retracement level(2.61).
Anyhow, the technical chart shows the formation of flag pattern in the daily time frame. This pattern represents a short resting period for the token price before it could continue its upside rally.
The MANA token price trading above the 100 and 200 EMA states a bullish trend. However, on the flip side, the 50 and 20 EMA lines could act as a valid resistance level.
The daily-Stochastic RSI shows recovery signs from the oversold region. The indicators displays several bullish crossovers between the K and D lines as it is charging towards the higher levels.
MANA Token 4-hour Time Frame Chart
 Source- Tradingview
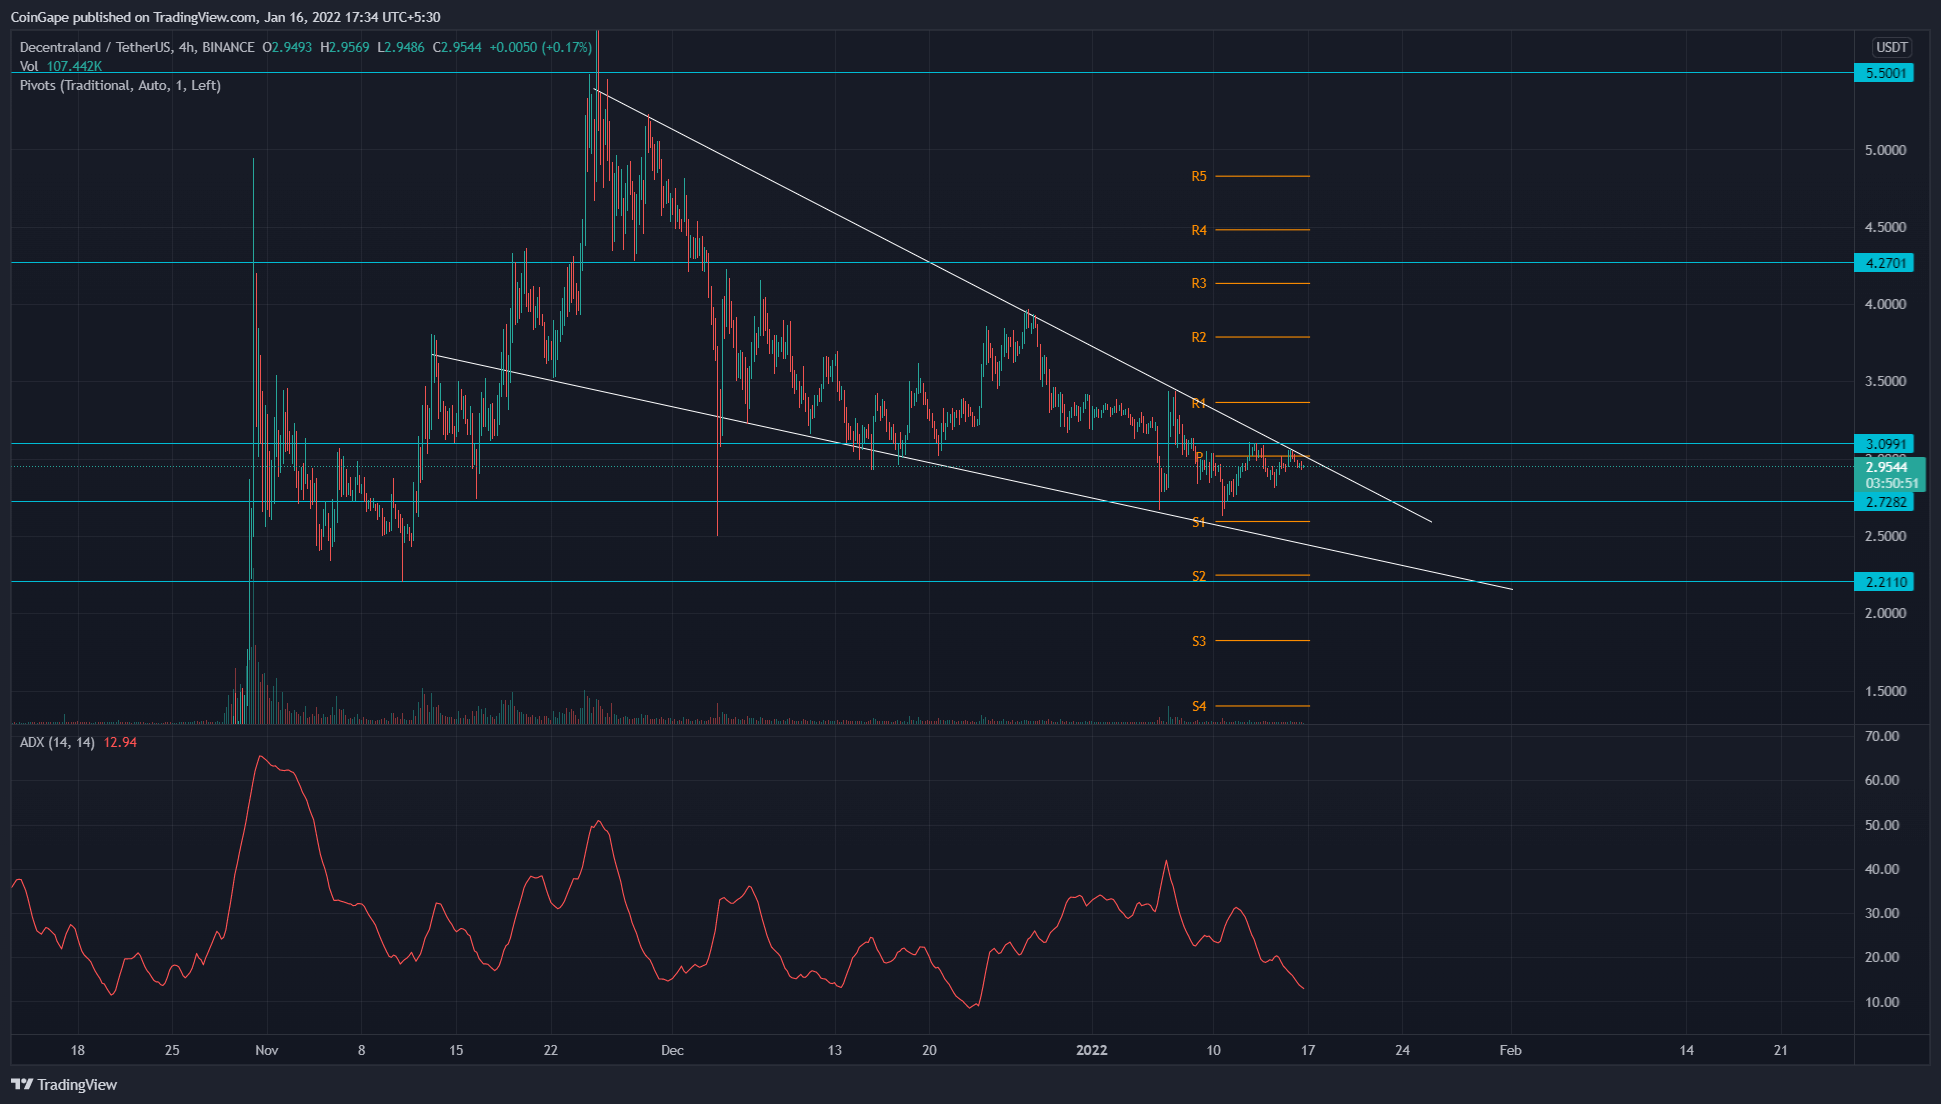
The MANA token price is currently trading at $2.95, with an intraday loss of 1.03%. The crypto traders should be patient till the price give a proper breakout from the overhead resistance, providing an excellent entry opportunity for them.
The average directional movement index(13) displays a downward slope, indicating the losing selling momentum.
The traditional pivot level indicates the overhead resistance for MANA price is $3 and 3.36. As for the opposite side, the support levels are $2.6, followed by $2.2.
Instant Currency Exchange at BestChange with Ease
- Compare Rates Across 1000+ Exchanges
- Access 250+ Cryptocurrencies & Pairs
- Save Time with Real-Time Price Tracking
- Trusted & Verified Exchange Listings

Why Trust CoinGape
CoinGape has covered the cryptocurrency industry since 2017, aiming to provide informative insights Read more…to our readers. Our journal analysts bring years of experience in market analysis and blockchain technology to ensure factual accuracy and balanced reporting. By following our Editorial Policy, our writers verify every source, fact-check each story, rely on reputable sources, and attribute quotes and media correctly. We also follow a rigorous Review Methodology when evaluating exchanges and tools. From emerging blockchain projects and coin launches to industry events and technical developments, we cover all facets of the digital asset space with unwavering commitment to timely, relevant information.






Clarity Act (H.R.3633) signed into law in 2026?