FTM Price Analysis: FTM Prices Trapped Under Bearish Multiverse


A fresh falling channel pattern drives the Fantom(FTM) price to the ground or below the $1 mark in a less demeaning way. The recent bearish reversal brings the altcoin to $0.70 with an engulfing candle, struggling to continue underneath it. However, till the $0.6 support level stands, a bullish reversal possibility and an opportunity to buy this dip remain on the card.
Key points
- The EMAs maintain a falling trend in bearish alignment.
- A secondary bearish pattern increases the seller’s command over the trend.
- The intraday trading volume in the FTM Network coin is $ Million, indicating a % gain.
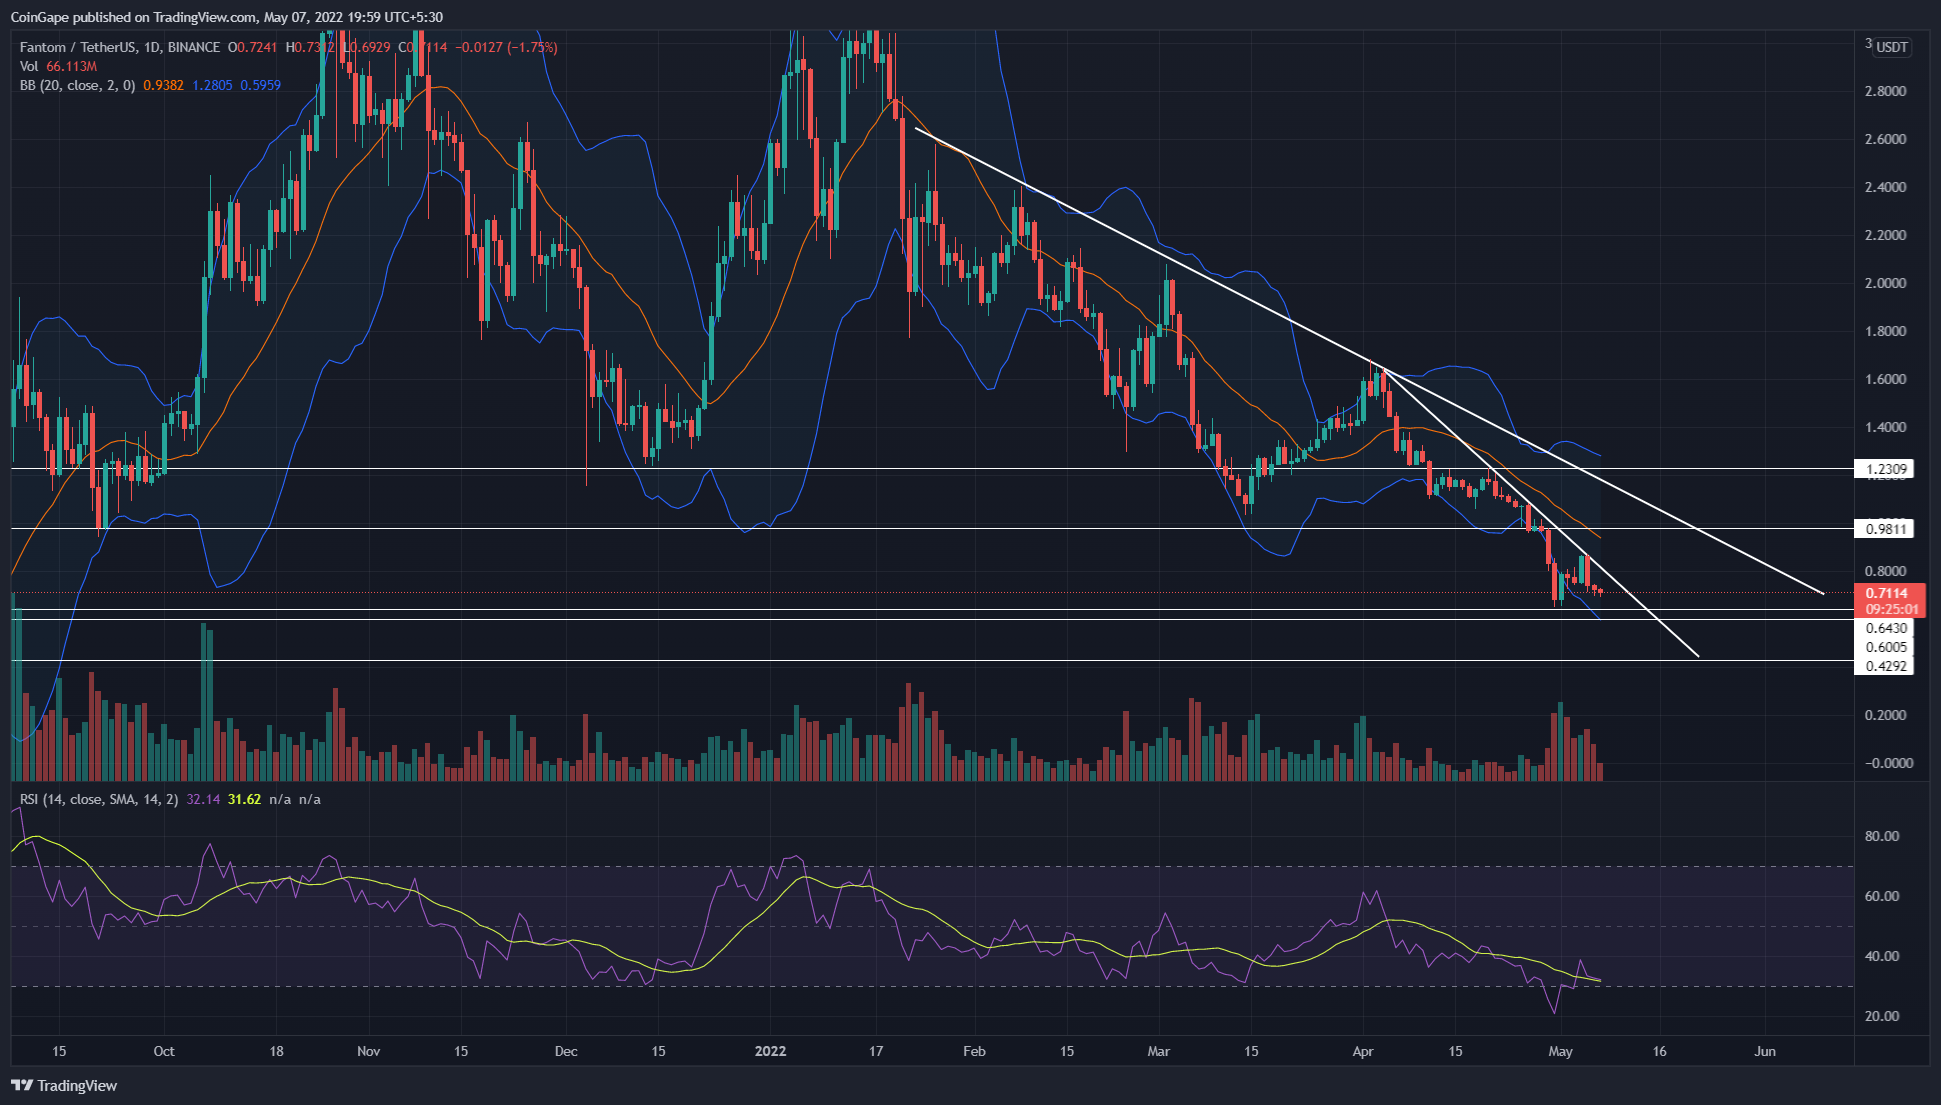 Source-Tradingview
The Fantom(FTM) price continues to decline due to a steeper downsloping trendline that creates a bearish second wave within a descending channel. furthermore, the falling trend cuts the market value by half in the last month, resulting in the psychological breakout of $1.
The bearish pattern forming within the more significant trend reflects an astonishing increase in the downtrend momentum. Additionally, the intraday trading volume has increased over the past week, reflecting the increased interest in the token in the market.
The FTM holders bring lower price rejection around the $0.70 mark following the bearish candle pattern, reflecting the entry of new buyers to block the downtrend. But, traders desiring a reversal need to wait until the uprise undermines the bearish candle and closes above $0.85.
However, any unexpected buying spree above $0.85 may retest the $1 to replenish the bullish momentum.
On the lower side, a further increase in selling pressure will drive the trend below the $0.70 support level to the next support at $0.66.
Technical indicator
The declining Bollinger band indicator accentuates an overall bear market. Moreover, the coin price struggles to surpass the indicator’s midline, suggesting aggressive selling from traders.
However, the daily-RSI slope shows an evident bullish divergence concerning the April 30th retest to the $0.65 support. This divergence indicates the coin price face strong buying pressure at this support.
- Resistance level- $1 and $1.25
- Support levels- $0.64-$0.6 and $0.41

Why Trust CoinGape
CoinGape has covered the cryptocurrency industry since 2017, aiming to provide informative insights Read more…to our readers. Our journal analysts bring years of experience in market analysis and blockchain technology to ensure factual accuracy and balanced reporting. By following our Editorial Policy, our writers verify every source, fact-check each story, rely on reputable sources, and attribute quotes and media correctly. We also follow a rigorous Review Methodology when evaluating exchanges and tools. From emerging blockchain projects and coin launches to industry events and technical developments, we cover all facets of the digital asset space with unwavering commitment to timely, relevant information.

Related Articles

- Hong Kong Stablecoin Firm RedotPay Targets $1B Raise in Potential US. IPO Debut
- Crypto Market Crash: Glassnode & 10x Research Warn Deeper Bitcoin Price Fall Ahead
- Operation Chokepoint: Federal Reserve Advances Proposal to End Crypto Debanking
- LUNC News: Terraform Labs Administrator Sues Jane Street for Terra-LUNA Crisis
- Crypto.com Joins Ripple, Circle With Conditional Bank Charter Approval Amid WLFI’s Probe
- XRP Price Outlook as Clarity Act Passage Odds Plunge to 53%
- COIN Stock Risks Crashing to $100 as Odds of US Striking Iran Jump
- MSTR Stock Price Predictions As Michael Saylor’s Strategy Makes 100th BTC Purchase
- Top 3 Meme Coins Price Prediction As BTC Crashes Below $67k
- Top 4 Reasons Why Bitcoin Price Will Crash to $60k This Week
- COIN Stock Price Prediction: Will Coinbase Crash or Rally in Feb 2026?


