SUSHI Price Prediction: Flag Pattern Hints 50% Recovery In SUSHI Price


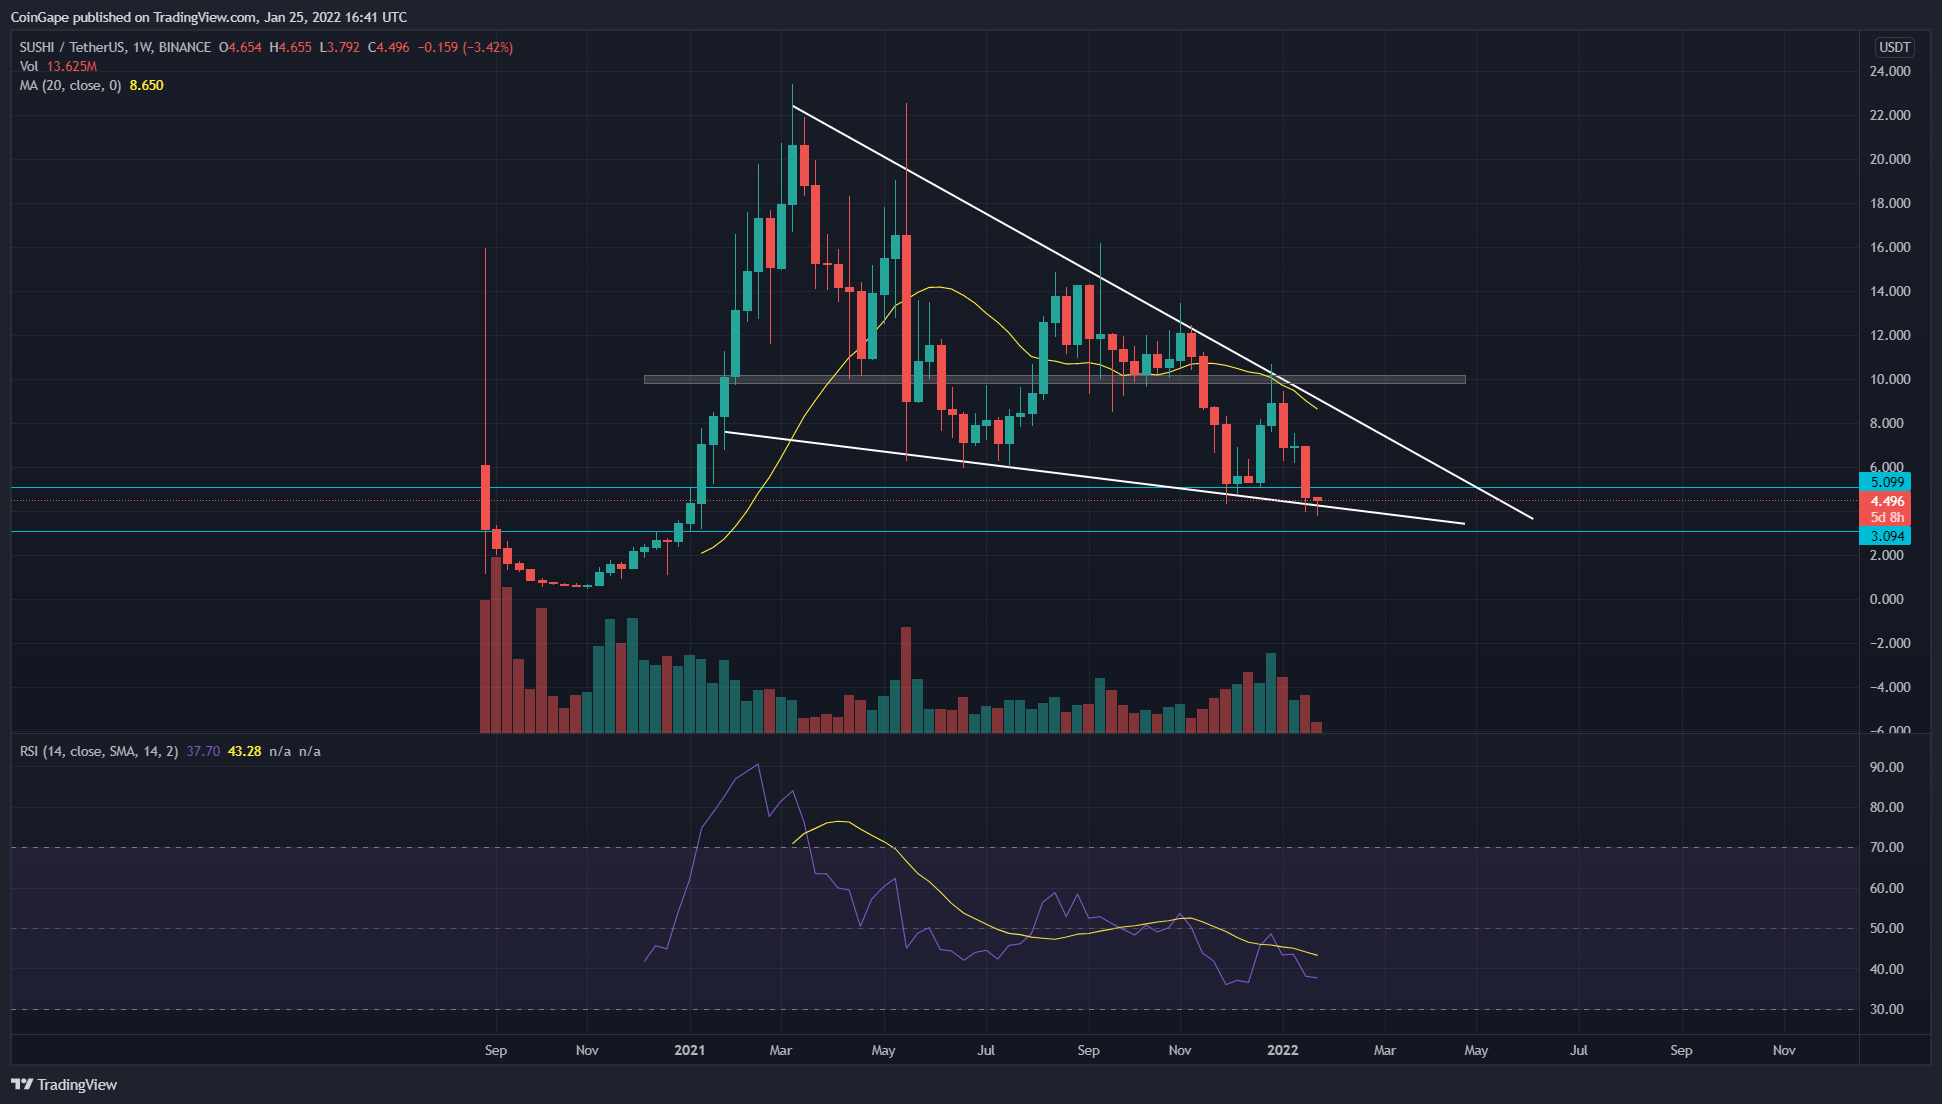
The SUSHI price chart displays the formation of flag patterns in the weekly time frame chart. The price action has been strictly following this pattern and has recently caused a 60% free-fall. The bulls will resume their buying by obtaining support from the falling trendline, indicating a reasonable possibility of bullish reversal.
Key technical points:
- The SUSHI price chart shows several lower price rejection candles at $4.5 support.
- The weekly-20 MA line provides strong resistance to SUSHI price
- The intraday trading volume in SUSHI/USD is $209.4 Million, indicating a 34.5% fall.
 Source- Tradingview
In our previous coverage of SUSHI technical analysis, the recovery rally in SUSHI price challenged a combined resistance of $9.8 and the resistance trendline of the flag pattern. The coin price experienced strong supply from these overhead resistances and was rejected with a weekly-evening star pattern.
- This renewed selling pressure plummeted the coin price to the support trendline($4.5), indicating a 50% devaluation.
- The crucial EMAs(20, 50, 100, and 200) indicate a bearish alignment in the daily time frame chart. Moreover, a negative crossover from the 20 and 50 EMA accelerates the ongoing selling.
- The weekly-Relative Strength index(34) slopes show a slight bullish divergence in the bearish territory.
Will SUSHI Bulls Reclaim The $5 Mark?
 Source-Tradingview
On January 21st, the SUSHI price nosedived below the $5 support. However, the coin buyers still defended the support trendline displaying multiple lower price rejection candles. The coin price could pull back to retest this flipped resistance($5); however, under the influence of the flag pattern price shows a high possibility to breach this resistance.
The Daily-Stochastic RSI provides a bullish crossover of the K and D line in the oversold region, indicating the price could start to rally.
- Resistance levels- $5, $6.2
- Support levels- $4 and $3
Why Trust CoinGape
CoinGape has covered the cryptocurrency industry since 2017, aiming to provide informative insights Read more…to our readers. Our journal analysts bring years of experience in market analysis and blockchain technology to ensure factual accuracy and balanced reporting. By following our Editorial Policy, our writers verify every source, fact-check each story, rely on reputable sources, and attribute quotes and media correctly. We also follow a rigorous Review Methodology when evaluating exchanges and tools. From emerging blockchain projects and coin launches to industry events and technical developments, we cover all facets of the digital asset space with unwavering commitment to timely, relevant information.


