AAVE Price Analysis : $95 Breakdown Rease 25% Fall In AAVE Price


On May 12th, the AAVE/USDT pair rebounded from the new lower low of $65.5 and reverted to the descending trendline. This pullback gives trade opportunities to short-sellers with a target of 25% down to $65.5. However, can they provide a legit breakdown from $65.5?
Key points:
- The AAVE price plans another reversal from the falling trendline
- The AAVE buyers regain the first line of EMA defense-20 DMA
- The intraday trading volume in AAVE/USD is $387 Million, indicating a 94% gain
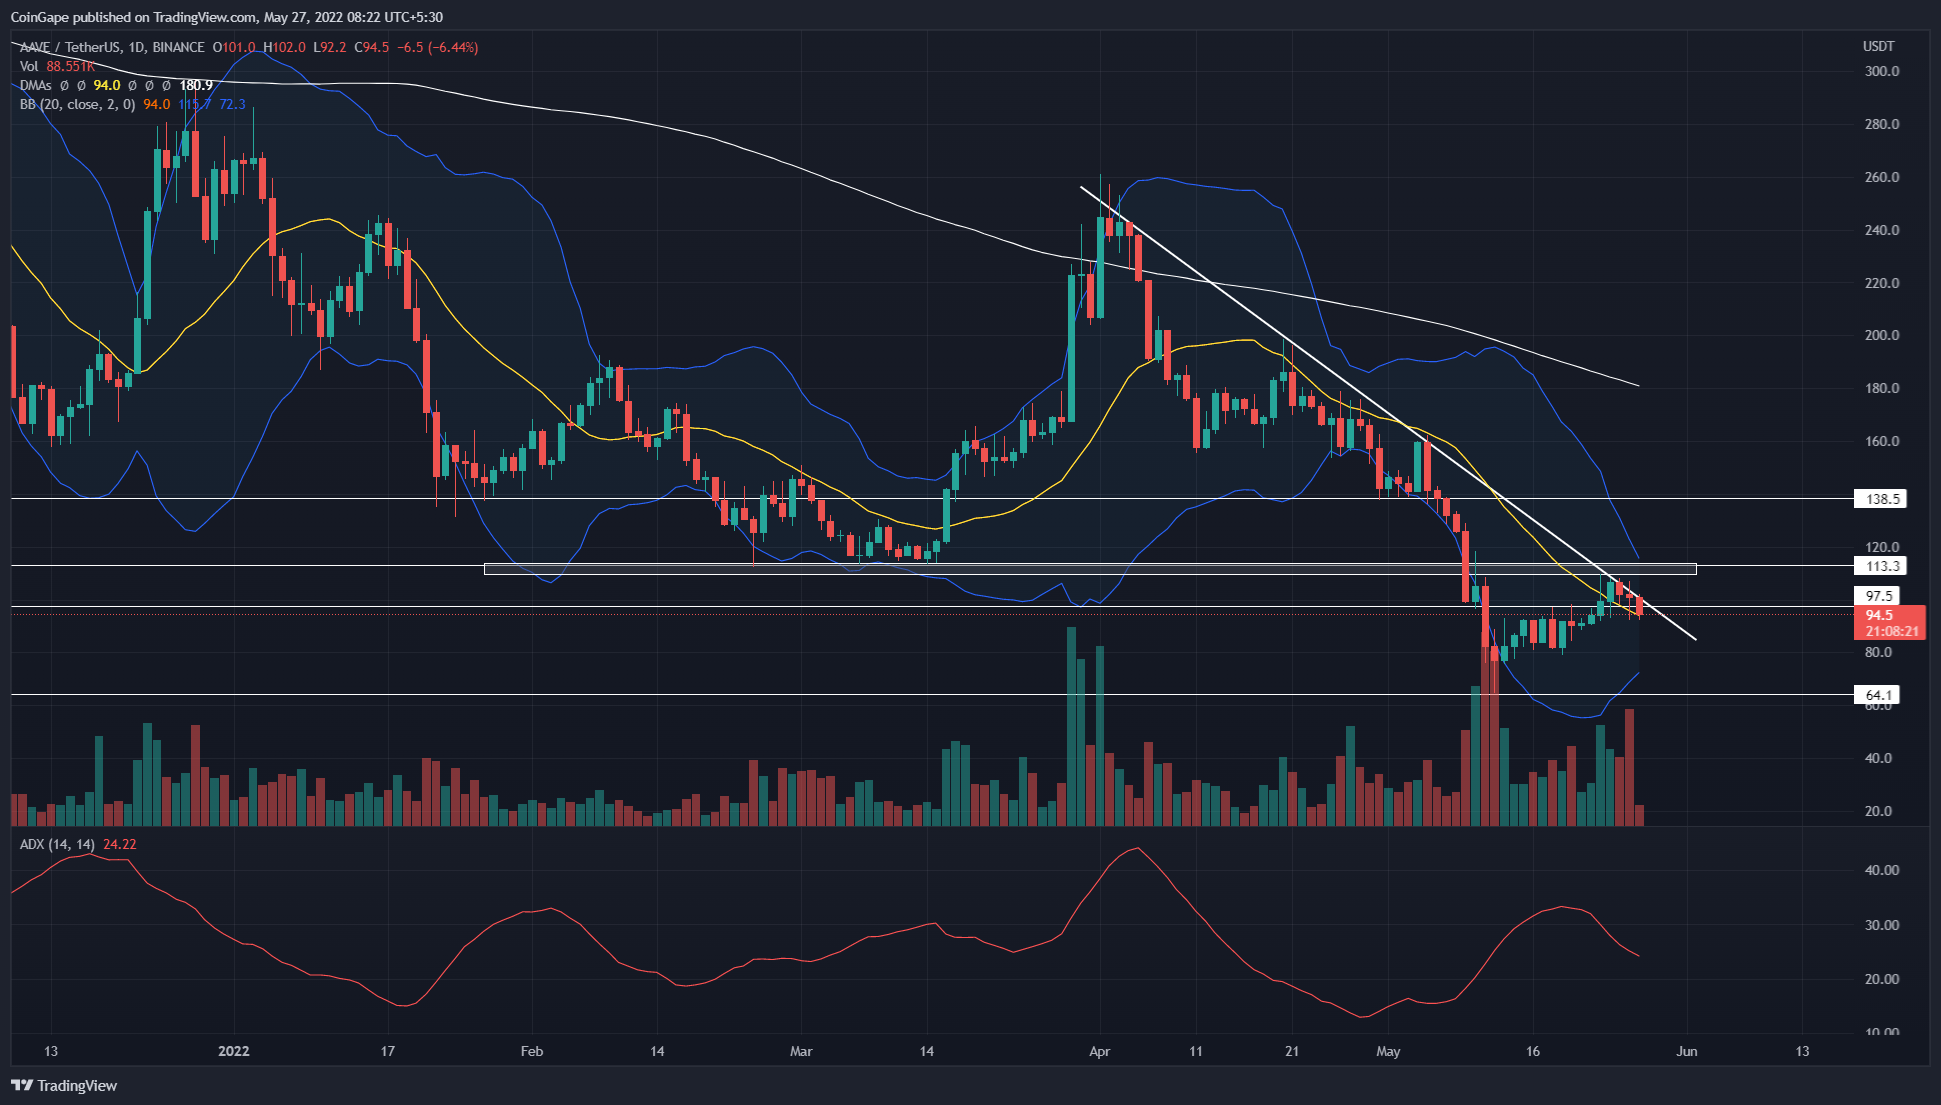 Source- Tradingview
Under the influence of a descending trendline, the AAVE price has been gradually falling for nearly two months. During this phase, the altcoin turned down from the high of $250 and plunged to a low of $65.5 mark, registering a 74.4% loss.
Furthermore, the recent bullish pullback from $65.5 support surged the AAVE price 64% higher and retested the overhead resistance again. Moreover, the altcoin even breached an immediate resistance of $94.3, which may encourage buyers to breach the overhead resistance.
However, the AAVE struggles between the dynamic resistance and the new flipped support suggest an uncertain no trading zone.
A bullish breakout from the above resistance would drive the altcoin 160% higher to $250.
Alternatively, a breakdown from the $94.3 support would tumble the price 25% lower to the $65.5 mark.
Technical indicator
ADX indicator: A slight pullback in the daily-ADX slope indicates a loss of bearish momentum during the recent pullback to the resistance trendline. However, If the sellers successfully pull the coin price below $94.6 support, the ADX may rise back to accentuate the seller’s commitment.
Bollinger band: Along with the descending trendline, the midline of the Bollinger band indicator provides a dynamic resistance. Moreover, a failed attempt to reclaim this resistance could bolster the bearish theory.
- Resistance levels: $115 and $137
- Support levels: $96 and $80
Why Trust CoinGape
CoinGape has covered the cryptocurrency industry since 2017, aiming to provide informative insights Read more…to our readers. Our journal analysts bring years of experience in market analysis and blockchain technology to ensure factual accuracy and balanced reporting. By following our Editorial Policy, our writers verify every source, fact-check each story, rely on reputable sources, and attribute quotes and media correctly. We also follow a rigorous Review Methodology when evaluating exchanges and tools. From emerging blockchain projects and coin launches to industry events and technical developments, we cover all facets of the digital asset space with unwavering commitment to timely, relevant information.