Bitcoin Price Analysis: BTC Holds $23,500; Time To Exit?


Bitcoin price analysis indicates a sideways movement with a neutral bias. The price has been trading in a narrow range for the past few sessions, reflecting a resting mood among investors. As they look directionless near the critical resistance zone.
As of press time, BTC/USD is reading at $23,489.00, up 0.64% for the day. The trading volume declined more than 10% to $27.02 billion, with a market dominance of 40%.
- Bitcoin price trades with minute gains on Thursday.
- The price is holding a key support level making bulls hopeful.
- However, a daily candlestick below $23,200 would mark the end of the upside momentum in the short term.
Bitcoin price turns hostile
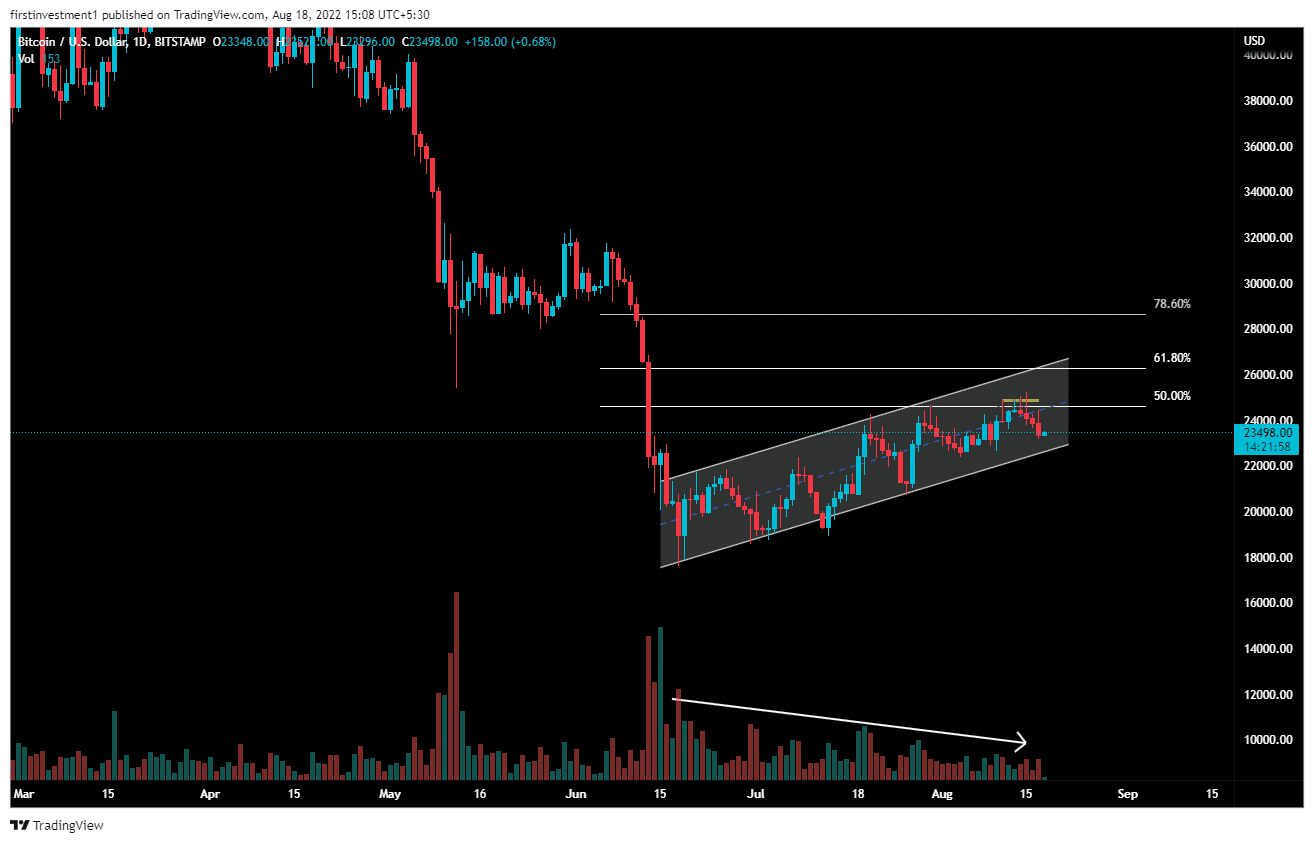
On the daily chart, the Bitcoin price analysis implies caution before aggressive bids
BTC is trading in a “Rising Wedge” pattern. A rising wedge is generally a bearish signal as it indicates a possible reversal during an uptrend. The formation indicates the likelihood of a downside momentum after a breakout through the lower trend line.
According to this pattern, if the price closes below the structured rising support line, then it would take a turnaround to bearish momentum from bullish momentum.
The expected fall could be around $21,300, which also acts as a previous swing low, and a 50% Fibonacci Retrecamnet of the impulse move from $17,671 to $24,900 started from June 18 – Aug. 11.
The volumes are declining, with the rising price, which implies a worrisome. When the market is rising while volume is declining, the big money is not the one buying, more likely slowly exiting positions.
Further, the price faces rejection near $24,000 with indecisive candles, indicating the buyer seems apprehensive to carry forward the gains. In addition, the BTC/USD pair takes a heavy rejection of around $25,000 and then continues to fall.
The real question is, will the big players have exited from this recent move, and now, again come with selling?
If the price closes below $23,200, then this bullish move will take another course on the continuing trend of the long-term frame which is clearly “Bearish”.
The 4-hour chart on the same frequency
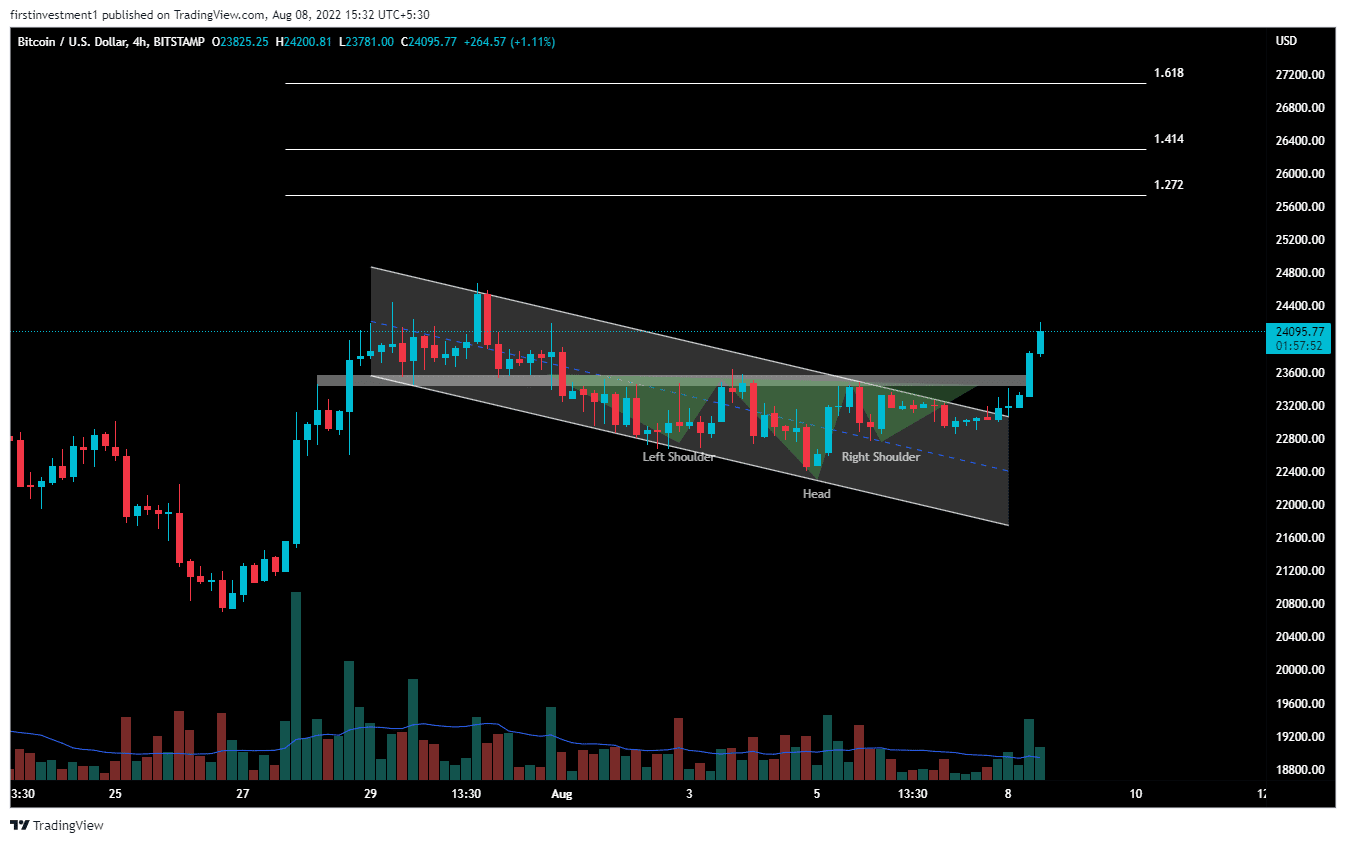
On the four-hour chart, BTC is still making higher highs and higher lows, but the new highs are at just rection candles, not bullish ones, even making a “Triple Top” pattern-like structure which is the reason, why a heavy sell-off is not happening yet. When the price breaks its recent swing low, on the lower side then we can expect a good fall.
On the other hand, a break above the $24,000 level could invalidate the bearish outlook. And the price can be above $26,200
BTC is bearish on all time frames. Below $23,200 closing on the hourly time frame, we can put a trade on the sell side.
Instant Currency Exchange at BestChange with Ease
- Compare Rates Across 1000+ Exchanges
- Access 250+ Cryptocurrencies & Pairs
- Save Time with Real-Time Price Tracking

Why Trust CoinGape
CoinGape has covered the cryptocurrency industry since 2017, aiming to provide informative insights Read more…to our readers. Our journal analysts bring years of experience in market analysis and blockchain technology to ensure factual accuracy and balanced reporting. By following our Editorial Policy, our writers verify every source, fact-check each story, rely on reputable sources, and attribute quotes and media correctly. We also follow a rigorous Review Methodology when evaluating exchanges and tools. From emerging blockchain projects and coin launches to industry events and technical developments, we cover all facets of the digital asset space with unwavering commitment to timely, relevant information.