Bitcoin Price Analysis: Bitcoin Just Lost This key Support; What’s Next?


In the last week, the Bitcoin (BTC) price chart showcased the bullish recovery facing rejection near $44,600, resulting in a retracement to the $39,650. However, the recent growth in selling pressure evident by the 4.65% fall over the last 24 hours results in the $39,650 fallout. Will Bitcoin prices create a bottom at the next support of $36,350?
 Source- Tradingview
The Bitcoin (BTC) price rally registered a 36% gain when the coin reached the $44650 mark. However, the sellers mounted stiff resistance at this level, resulting in a 6.81% retracement to $40000. On February 15th, the buyers made another bid to breach the overhead resistance, but the second rejection with an evening star pattern indicated the traders are selling on rallies.
The sustained selling has pulled the coin price below the $39600 support, threatening the continuation of the downtrend. The traders can expect a retest to the breakdown before the sellers sink the coin to January’s low($33000).
Anyhow, the traders should pay close attention to this support as a possible reversal could point to a bear trend bottom.
- Resistance level- $39640, $44650
- Support level- $36372, $30000
Technical indicator
The recent retracement has plunged the BTC price below the 20-and-50 EMA, reclaiming a bearish sequence among the crucial EMSa(20, 50, 100, and 200).
The MACD indicator provides a bearish crossover, reflecting a sell signal. Moreover, a breakdown from the neutral zone will accentuate the increasing bearish momentum.
BTC On-chain Data Indicates STH Are Under A Bearish Cloud
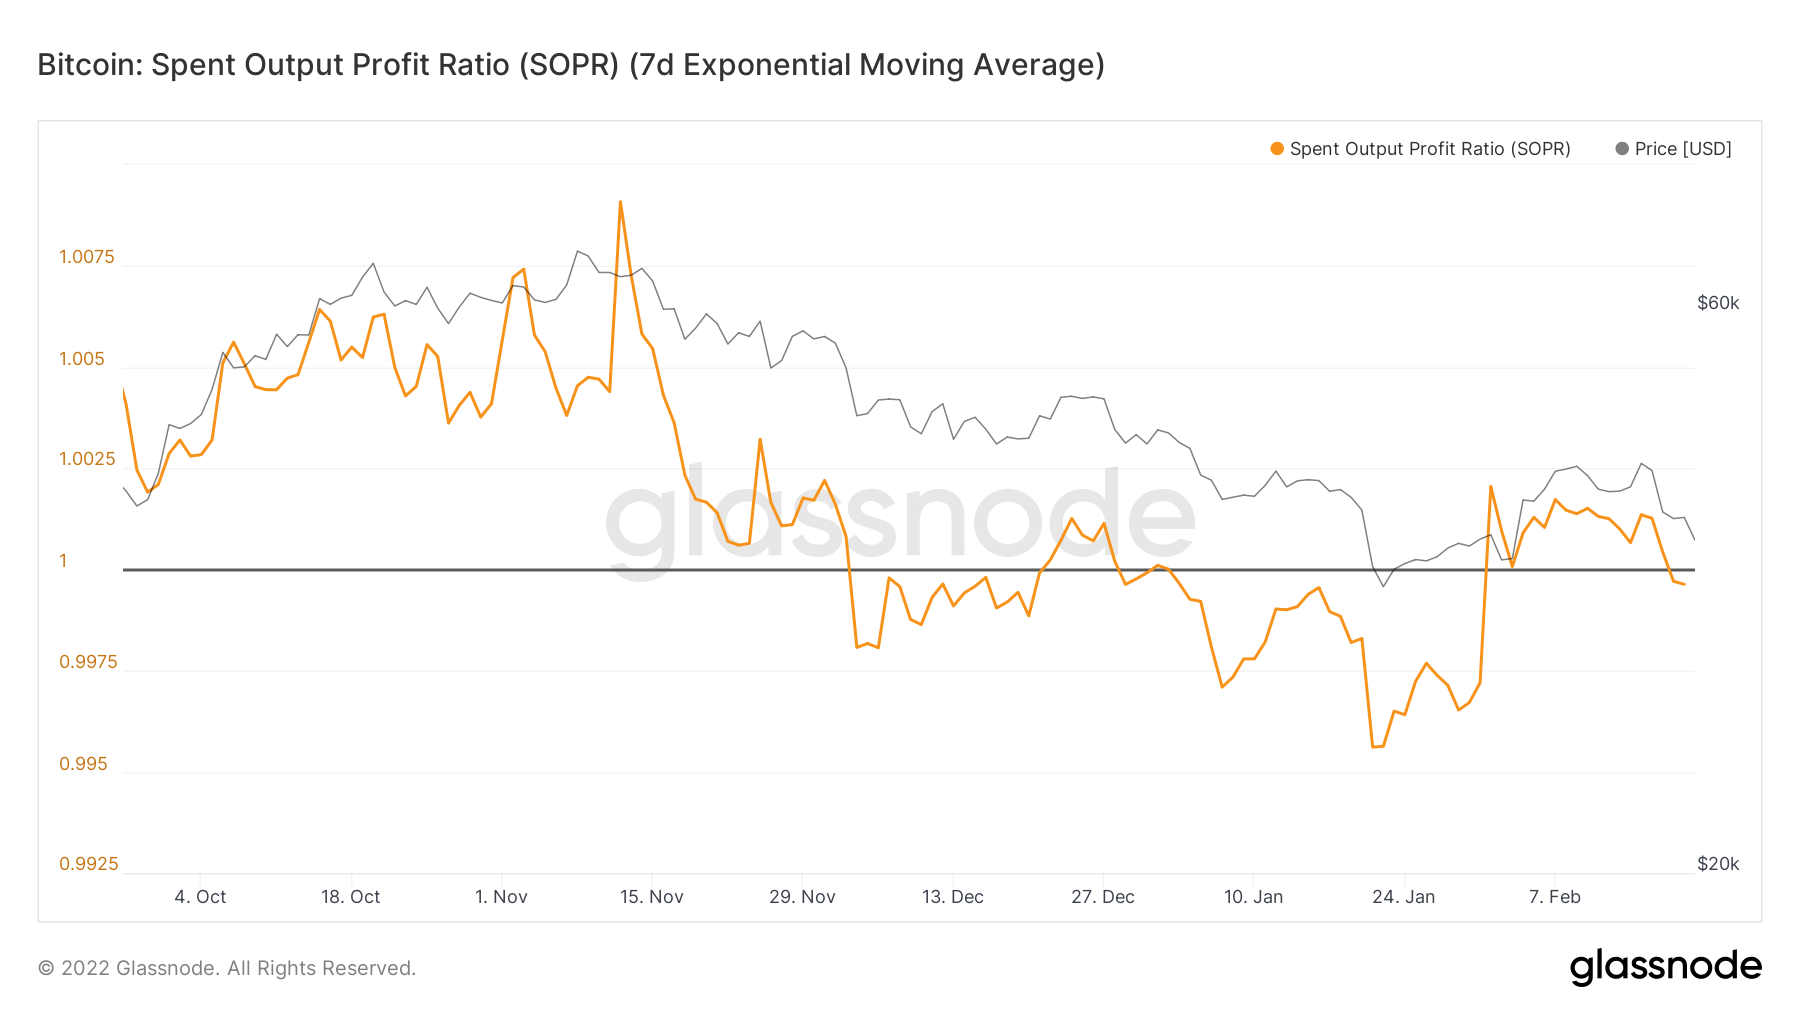
Source-Glassnode
Glassnode, an on-chain analytics firm, recently highlighted in their tweet, stating the Short-Term Holders are the most likely cohort to spend their coins in response to volatility.
The analyst displayed STH-NUPL and STH-MVRV metrics, which look into the unspent coin by the Short-Term Holder to determine their profit or loss as per the current price. Anyhow both these metrics are moving below their cost basis, i.e., (MVRV below 1 and NUPL below 0), indicating that on average the STH traders are holding on to losses.
Moreover, the STH-SOPR indicator which represents the degree of realized profit and loss for all coins moved on-chain, having a lifespan less than 155-days, is also moving below the 1 mark, indicating the STH are realizing losses.
Why Trust CoinGape
CoinGape has covered the cryptocurrency industry since 2017, aiming to provide informative insights Read more…to our readers. Our journal analysts bring years of experience in market analysis and blockchain technology to ensure factual accuracy and balanced reporting. By following our Editorial Policy, our writers verify every source, fact-check each story, rely on reputable sources, and attribute quotes and media correctly. We also follow a rigorous Review Methodology when evaluating exchanges and tools. From emerging blockchain projects and coin launches to industry events and technical developments, we cover all facets of the digital asset space with unwavering commitment to timely, relevant information.