MANA Price Prediction: Support Confluence Hints 25% Upside For Decentraland (MANA)


The Decentraland (MANA) price has seen a constant downfall since it last tested the ATH at $5.9 on Nov ‘21. The falling altcoin found first support at $3 and has been beaten down from the sellers-driven trendline finding itself in a symmetrical triangle. The current sideways rally now retests the support trendline. Can buyers wrest control from sellers at this support?
Key technical points:
- On the daily-Stochastic RSI indicator, the K and D are heading for a bullish crossover
- The MANA price trading above the 200-day EMA maintains an overall bullish trend.
- The 24-hour trading volume in the Decentraland token is $445 Million, indicating a 17.46% loss.

Source-Tradingview
Taking a breather from February’s selloff, the buyers surged the price by 21%, hitting the overhead resistance zone at the 50-day EMA. However, the sellers mounted a stiff resistance and reverted the altcoin as it rests at a crucial support confluence of the 200-EMA and the ascending trendline.
With the triple black crow formation and an attempt to break the crucial support at $2.4, the coin turns green, thus respecting the support and offering a sign of hope to the buyers.
The Stochastic RSI indicator shows the early onset of a bear cycle with the K and D lines taking a dive giving a crossover in the neutral zone. However, if buyers take over trend control near the support confluence, a reversal undermining the bearish crossover is possible.
Hope For MANA Grows With The Morning Star
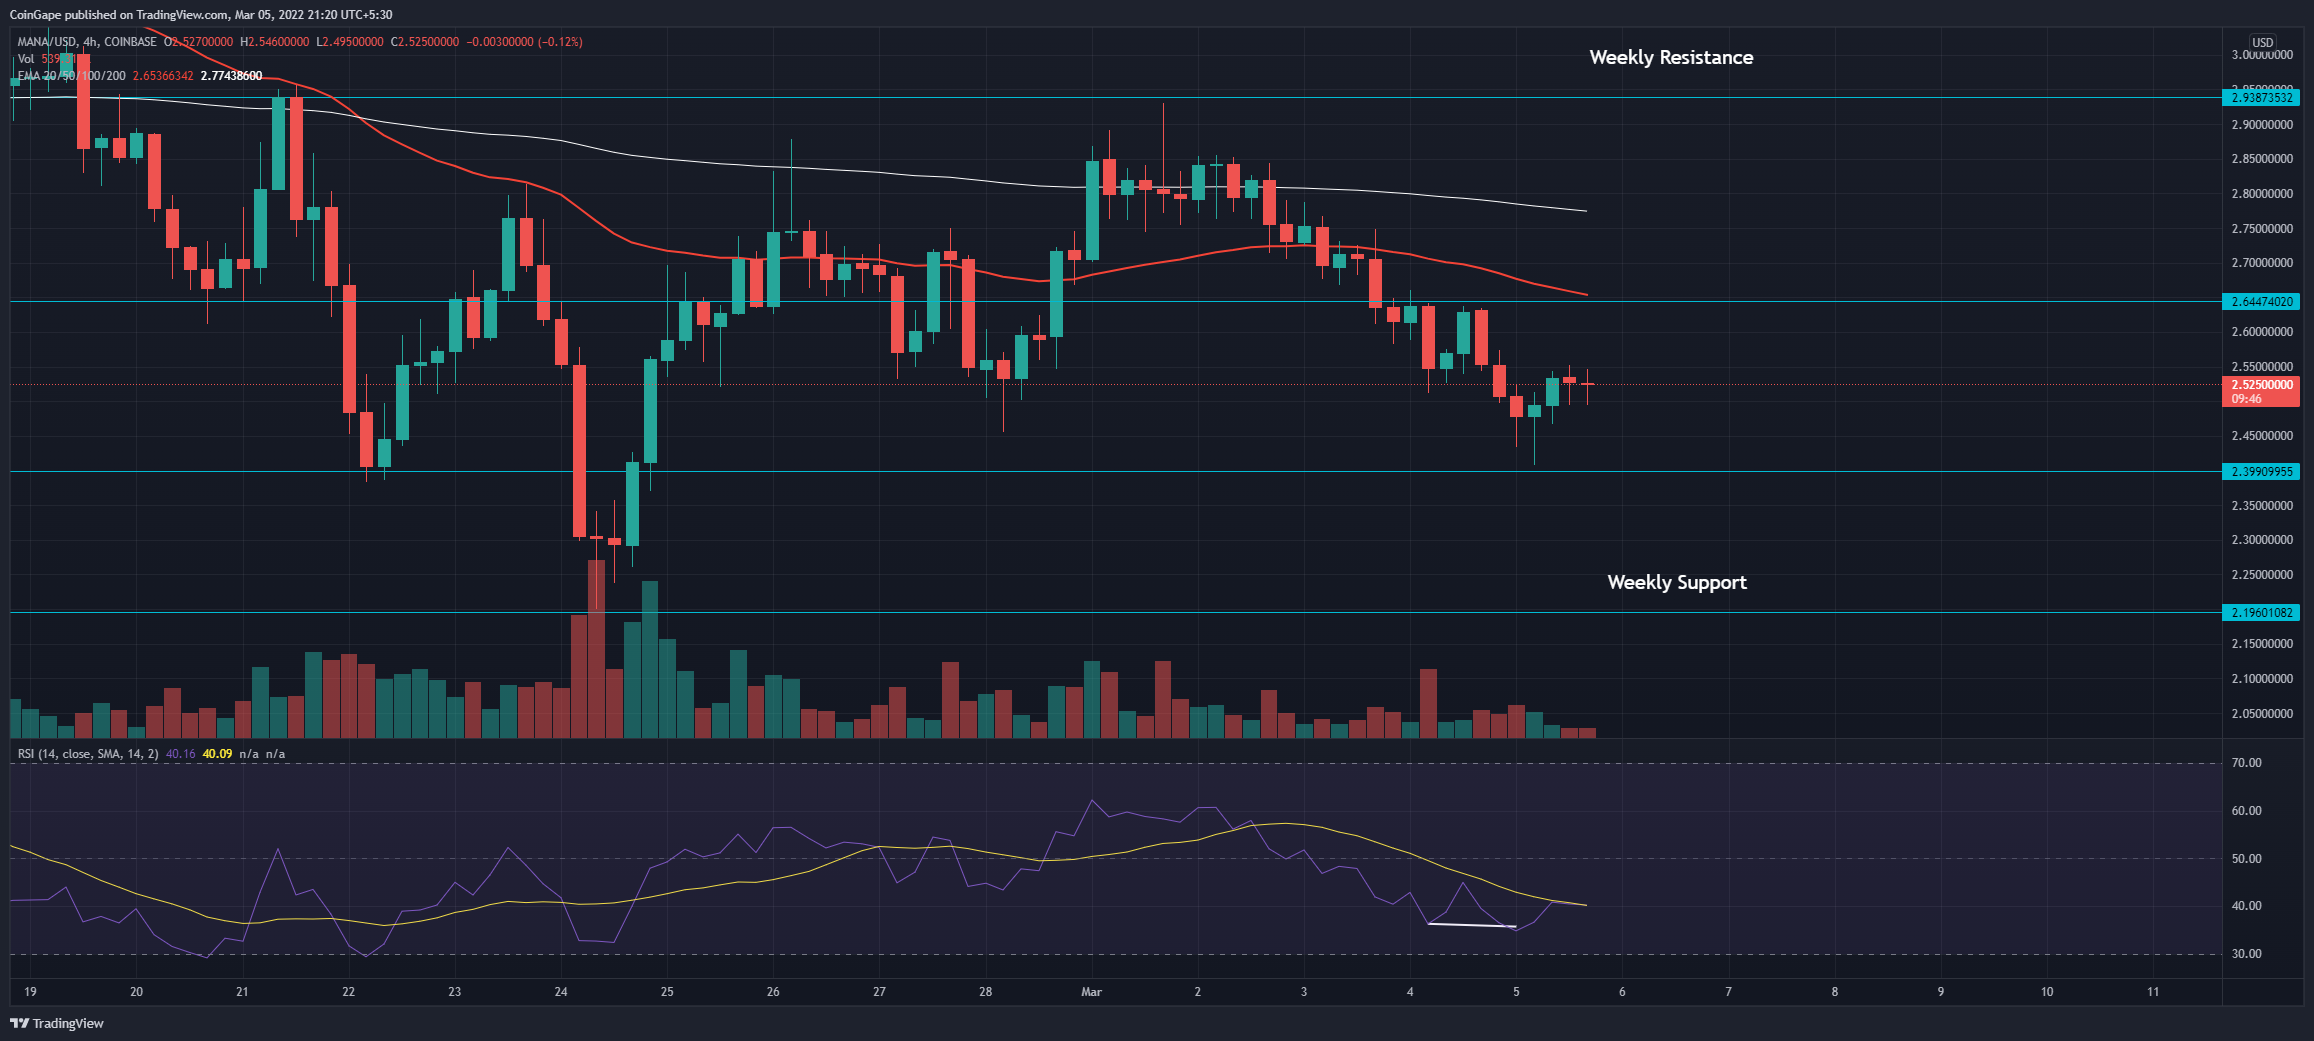
Source- Tradingview
MANA price takes support with the long tail formation and creates a morning star pattern at the $2.4 support in the 4-hour chart. Hence, a trend reversal is possible to test the $2.66 mark coinciding with the 50-period EMA.
The 4-hour RSI indicator shows a bullish divergence in the last two lower low formations. However, the slope remains under a bearish influence as it fails to surpass the 14-period SMA. Hence, a breakout of the SMA will generate a short-term buying possibility.
Alternately, If MANA’s price plunged below the $2.4 support, the bears would step in and plummet the altcoin 8% to the weekly support of $2.20.
Why Trust CoinGape
CoinGape has covered the cryptocurrency industry since 2017, aiming to provide informative insights Read more…to our readers. Our journal analysts bring years of experience in market analysis and blockchain technology to ensure factual accuracy and balanced reporting. By following our Editorial Policy, our writers verify every source, fact-check each story, rely on reputable sources, and attribute quotes and media correctly. We also follow a rigorous Review Methodology when evaluating exchanges and tools. From emerging blockchain projects and coin launches to industry events and technical developments, we cover all facets of the digital asset space with unwavering commitment to timely, relevant information.


Will Bitcoin reach $250,000 by December 31, 2026?