Solana Price Outlook as ETF Inflows Hit Three-Month High: Will SOL Recover to $100?


Highlights
- Solana ETF inflows reached $8.8 million, marking three-month highs.
- Recovery of $80 would help build momentum up to $90 and 100.
- Losing $74 support may expose Solana price to $70 downside risks.
Solana price fell 1.16% to $74.88 on Tuesday, despite posting gains during the previous seven days.
Broader market weakness weighed on SOL as total cryptocurrency cap dropped 0.6% to $2.17 trillion. However, Solana ETF inflows reached a three-month high, signaling stronger institutional interest in the asset.
Bitcoin price was trading above its short-term support of $64,000, and Ethereum price was trading under $1,900. Investors remained wary as hopes of a potential United States-Iran accord faded.
SOL needs to regain $80 to reinforce recovery and aim at the 90 resistance area. A break out above 90 decisively would open the way to 100. A failure to maintain a position of $74 can place SOL in further losses around $70.


Solana ETFs Record Biggest Inflows in Three Months
Solana exchange-traded funds had net inflows of $8.8 million, the best showing since three months earlier. The most recent investment amount was the highest in June, since May 12, based on data provided by Santiment.
Fresh fund flow occurred when SOL saw trade around $76.44 after a long run of price weakness. The inflow indicates that there can be a resurgence of institutional interest even when there are uncertain conditions in the broader cryptocurrency market. Recent ETF flows are not uniform, as some sessions have generated small investments or some withdrawals.
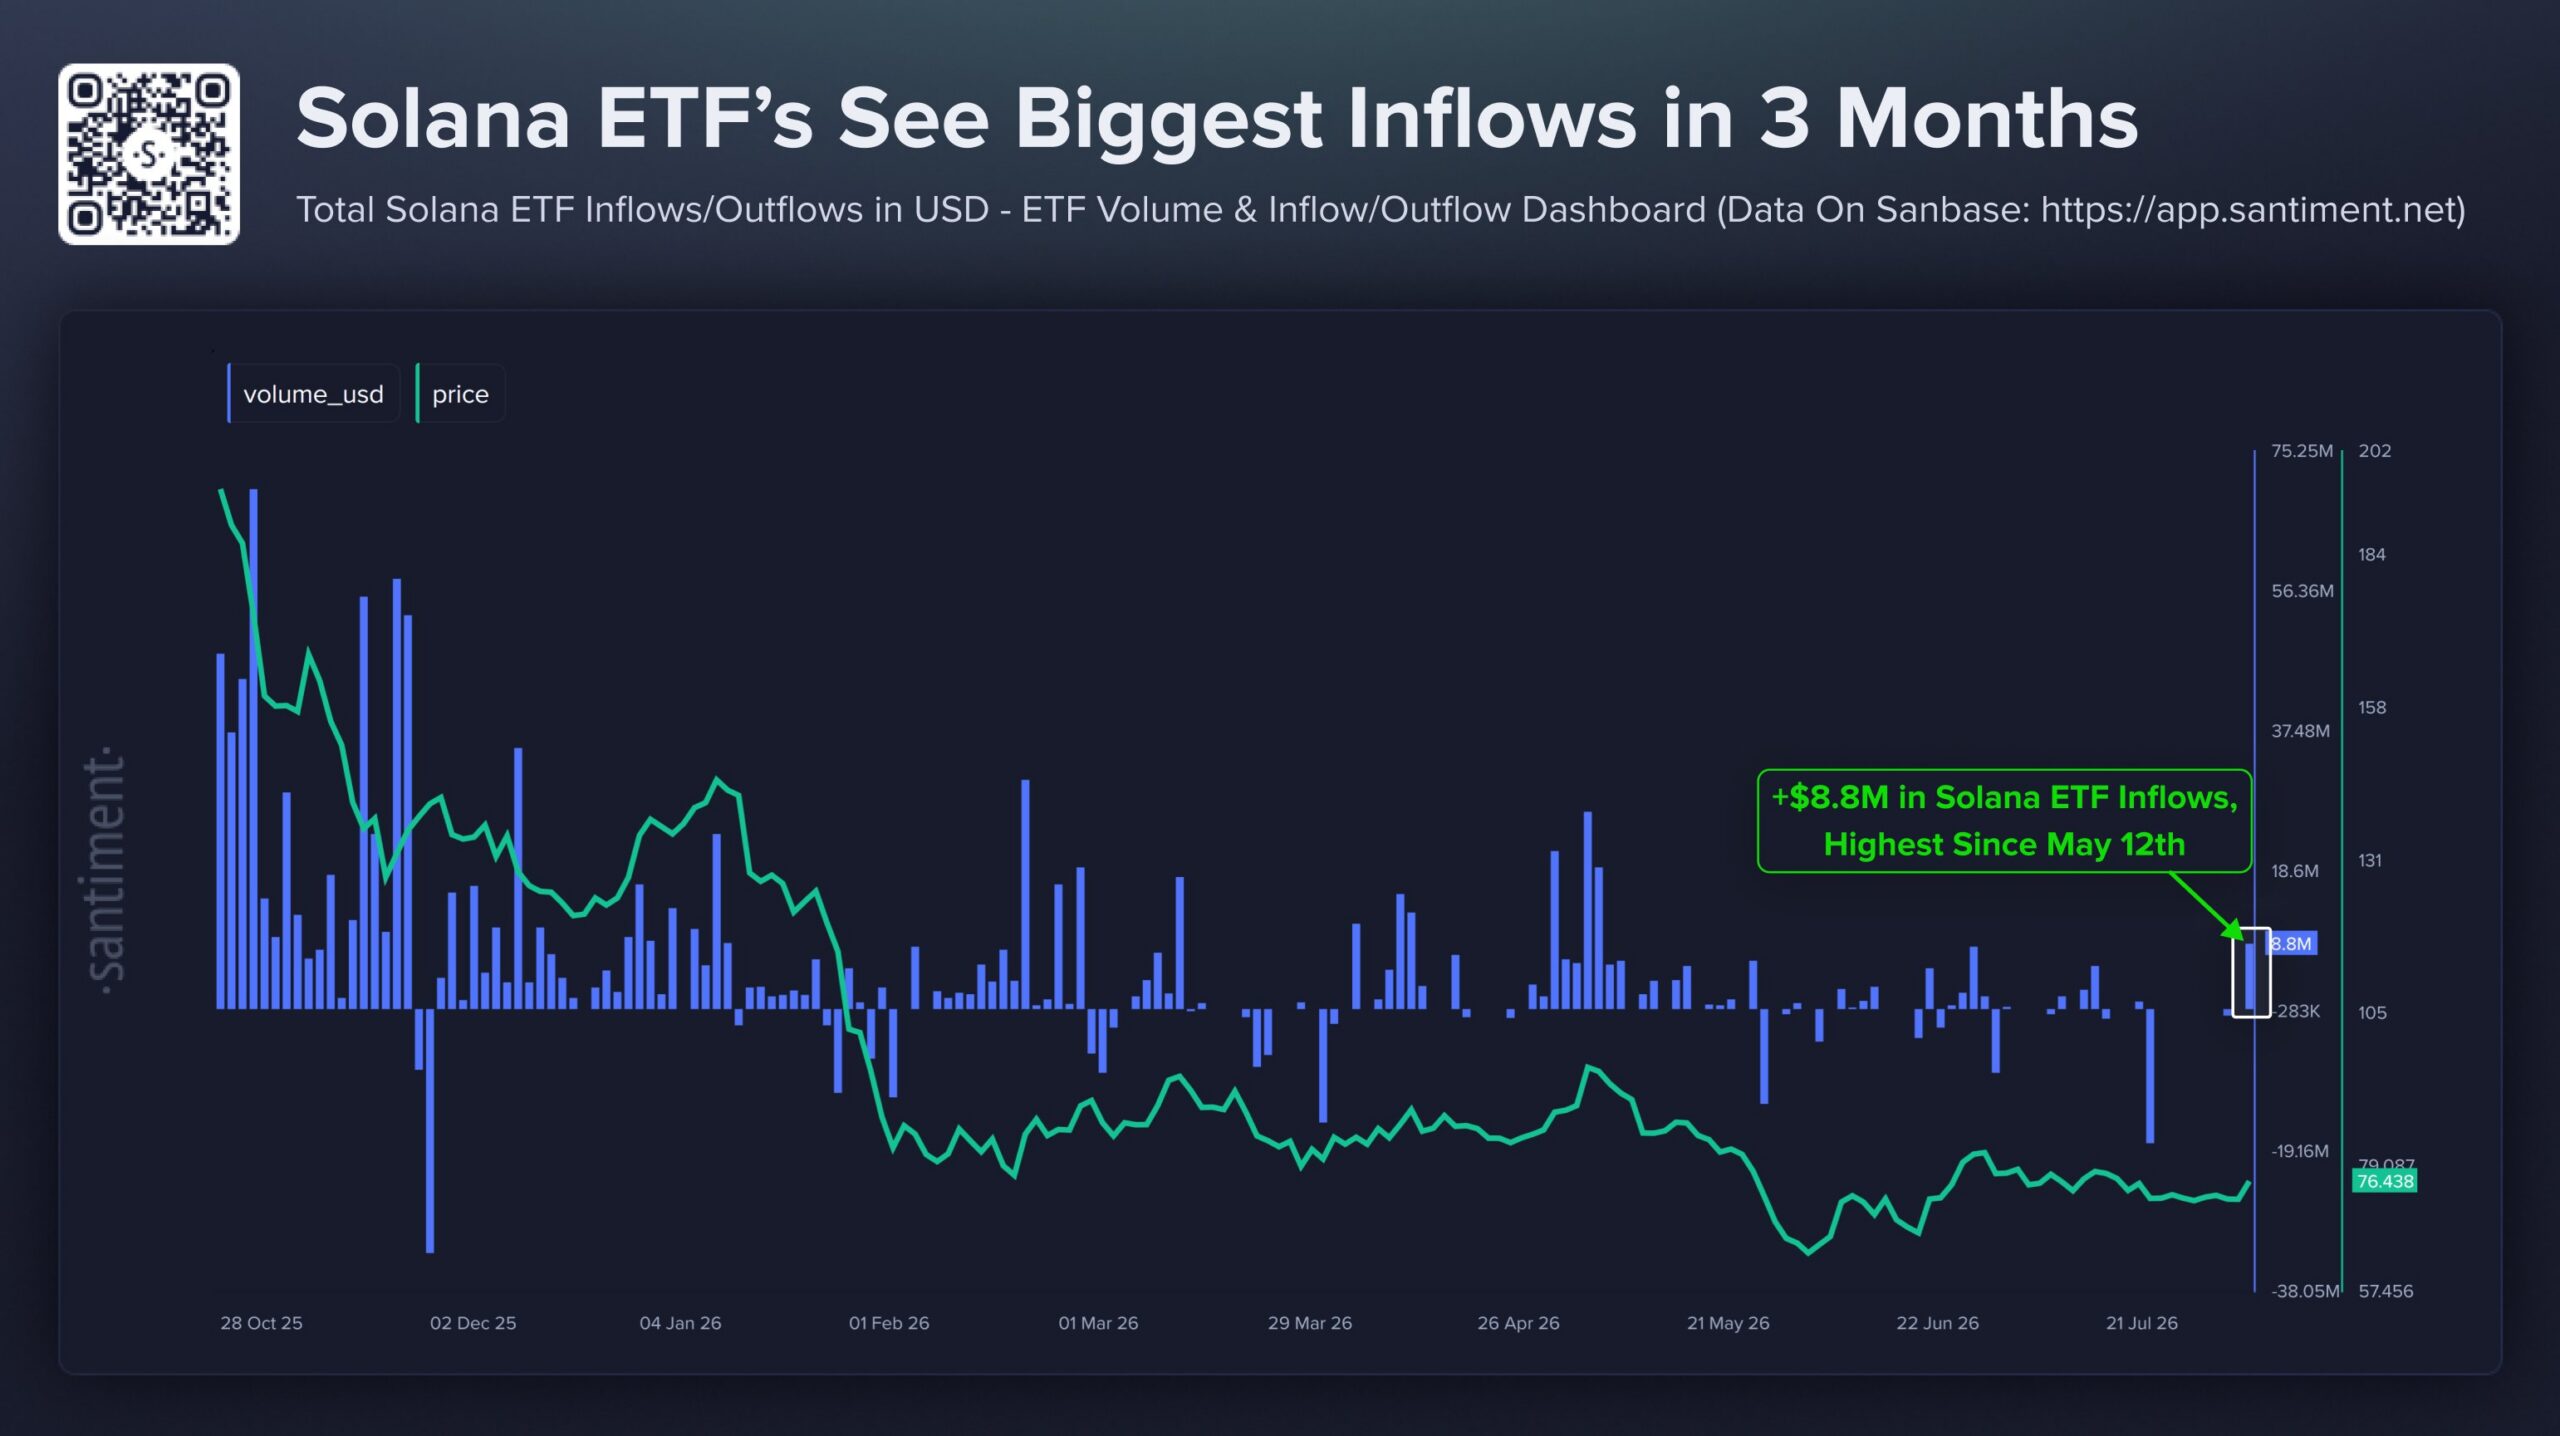
The most recent increase, however, is higher than activity observed during June, July and early August. Continued inflows might enhance market confidence and help Solana recover in the next trading sessions.

Is Solana Price Preparing for a Rebound to $100 Soon?
The SOL price traded at $74.94 after falling from the $77 resistance level on the four-hour timeframe.
Solana briefly rose to a high of 77.40 and its recent gains were wiped out by fresh selling. The pullback brought SOL to the important area of $75
The Moving Average convergence divergence indicator indicates a decreasing short-term momentum. Its MACD line is at 0.19 and below the 0.46 signal line.
Meanwhile, the histogram has fallen to negative 0.27. This reading suggests that the bearish pressure has intensified since it was rejected at around 77.
The Relative Strength Index of Solana is decreasing to 44.46. The reading is not oversold, but indicates declining demand
The RSI also sits below its 50 level, indicating a neutral trend.
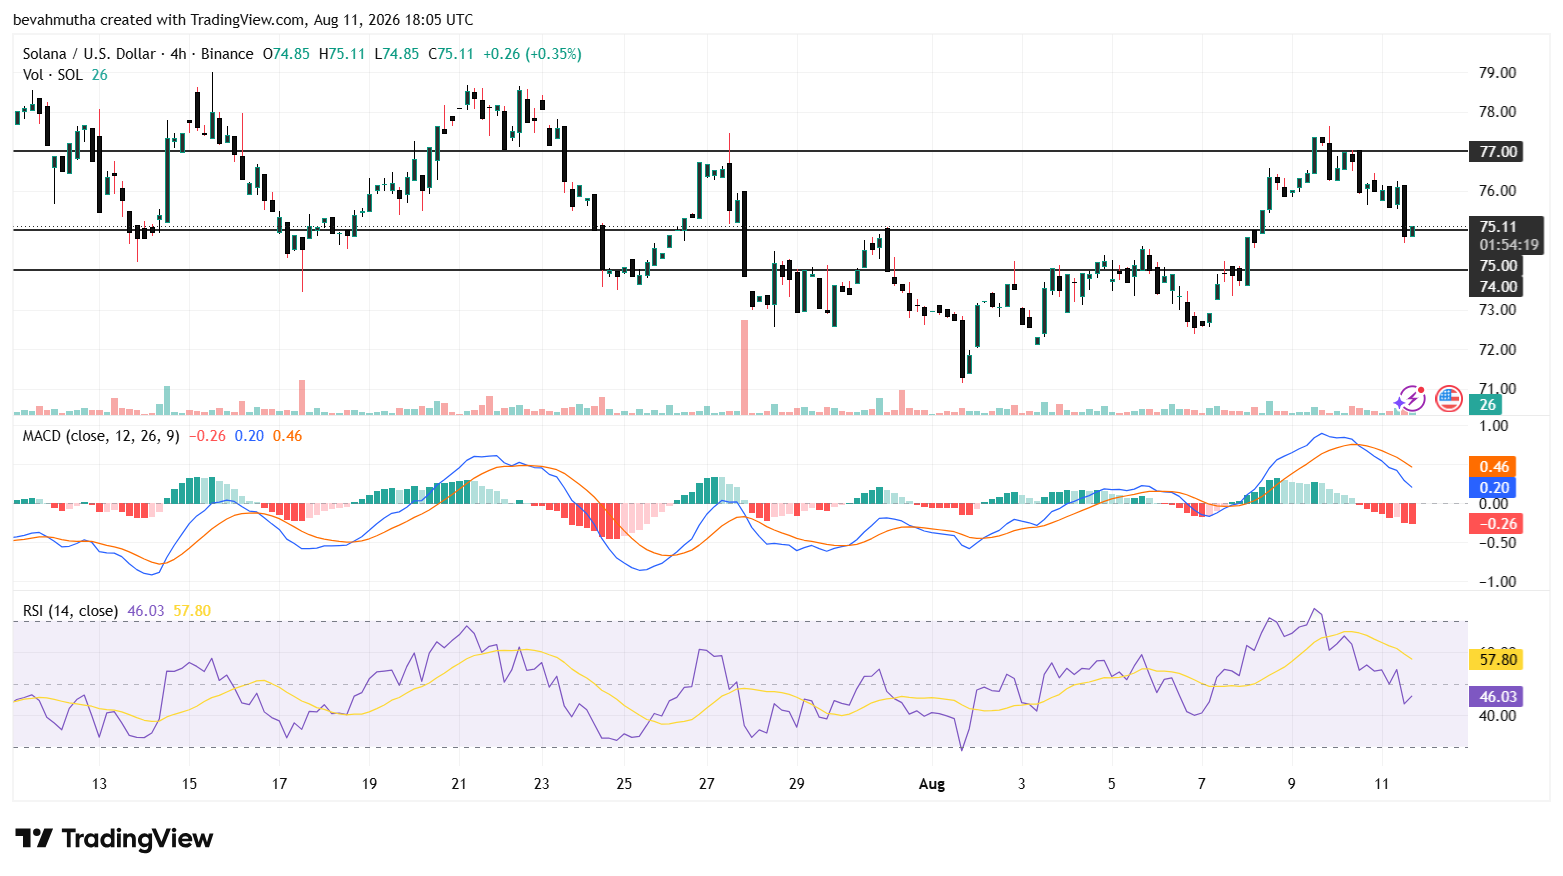
The following four-hour session may dictate the short-term course of Solana. There is still need to defend $74 so that another effort may be made at the higher resistance area.
A near break of 74 would undermine the present market set up. This would bring $73 and $72 within reach.
On the other hand, recovering 75 would be the initial indication of restored vigor. The full Solana forecast report would then be able to attack $76 before revisiting the big $77 barrier. And if the bullish trend strengthesn the SOL price could rally too $90-$100 in the near term.
Instant Currency Exchange at BestChange with Ease
- Compare Rates Across 1000+ Exchanges
- Access 250+ Cryptocurrencies & Pairs
- Save Time with Real-Time Price Tracking
- Trusted & Verified Exchange Listings

Frequently Asked Questions (FAQs)
1. . Why is the Solana price falling?
2. Why are Solana ETF inflows important?
Why Trust CoinGape
CoinGape has covered the cryptocurrency industry since 2017, aiming to provide informative insights Read more…to our readers. Our journal analysts bring years of experience in market analysis and blockchain technology to ensure factual accuracy and balanced reporting. By following our Editorial Policy, our writers verify every source, fact-check each story, rely on reputable sources, and attribute quotes and media correctly. We also follow a rigorous Review Methodology when evaluating exchanges and tools. From emerging blockchain projects and coin launches to industry events and technical developments, we cover all facets of the digital asset space with unwavering commitment to timely, relevant information.




Delivered every day.
- Insights that move markets
- 100,000 active subscribers

Global ONCHAIN AWARDS 2026