
Sandbox Price Analysis: Rounding Bottom Pattern Brings Recovery Opportunity For SAND Token


The correction phase in the SAND token plummeted the price to the 0.5 Fibonacci retracement level. This pair spent more than three weeks acquiring sufficient support from the bottom level, which eventually initiated this new rally. Moreover, the chart also shows a rounding bottom pattern which can lead the price to $8.5 or even beyond it.
Key technical points:
- The SAND price reclaims the 20-day EMA
- The 24-hour trading volume in the sandbox token is $2.82 Billion, indicating a 335.1% gain.
 Source-Tradingview
The last time when we covered an article on Sandbox token, its price resonated in a narrow range, extending from $4.6 support to $5.6 resistance zone. During this consolidation, the token price gained enough support to bounce back from the bottom support level.
On December 23rd, the token price provided a huge bullish engulfing candle of 22% gain, which breached the $5.6 and $6.1 resistance in one shot, offering a great opportunity for a long trade.
This new rally has flipped the 20 EMA dynamic resistance into possible support. Moreover, the daily chart has reclaimed its bullish alignment of the crucial EMAs(20, 50, 100, and 200).
The Relative strength index(61) projected significant recovery in its chart and has crossed above the neutral line(50).
Sandbox/USD 4-hour time frame chart
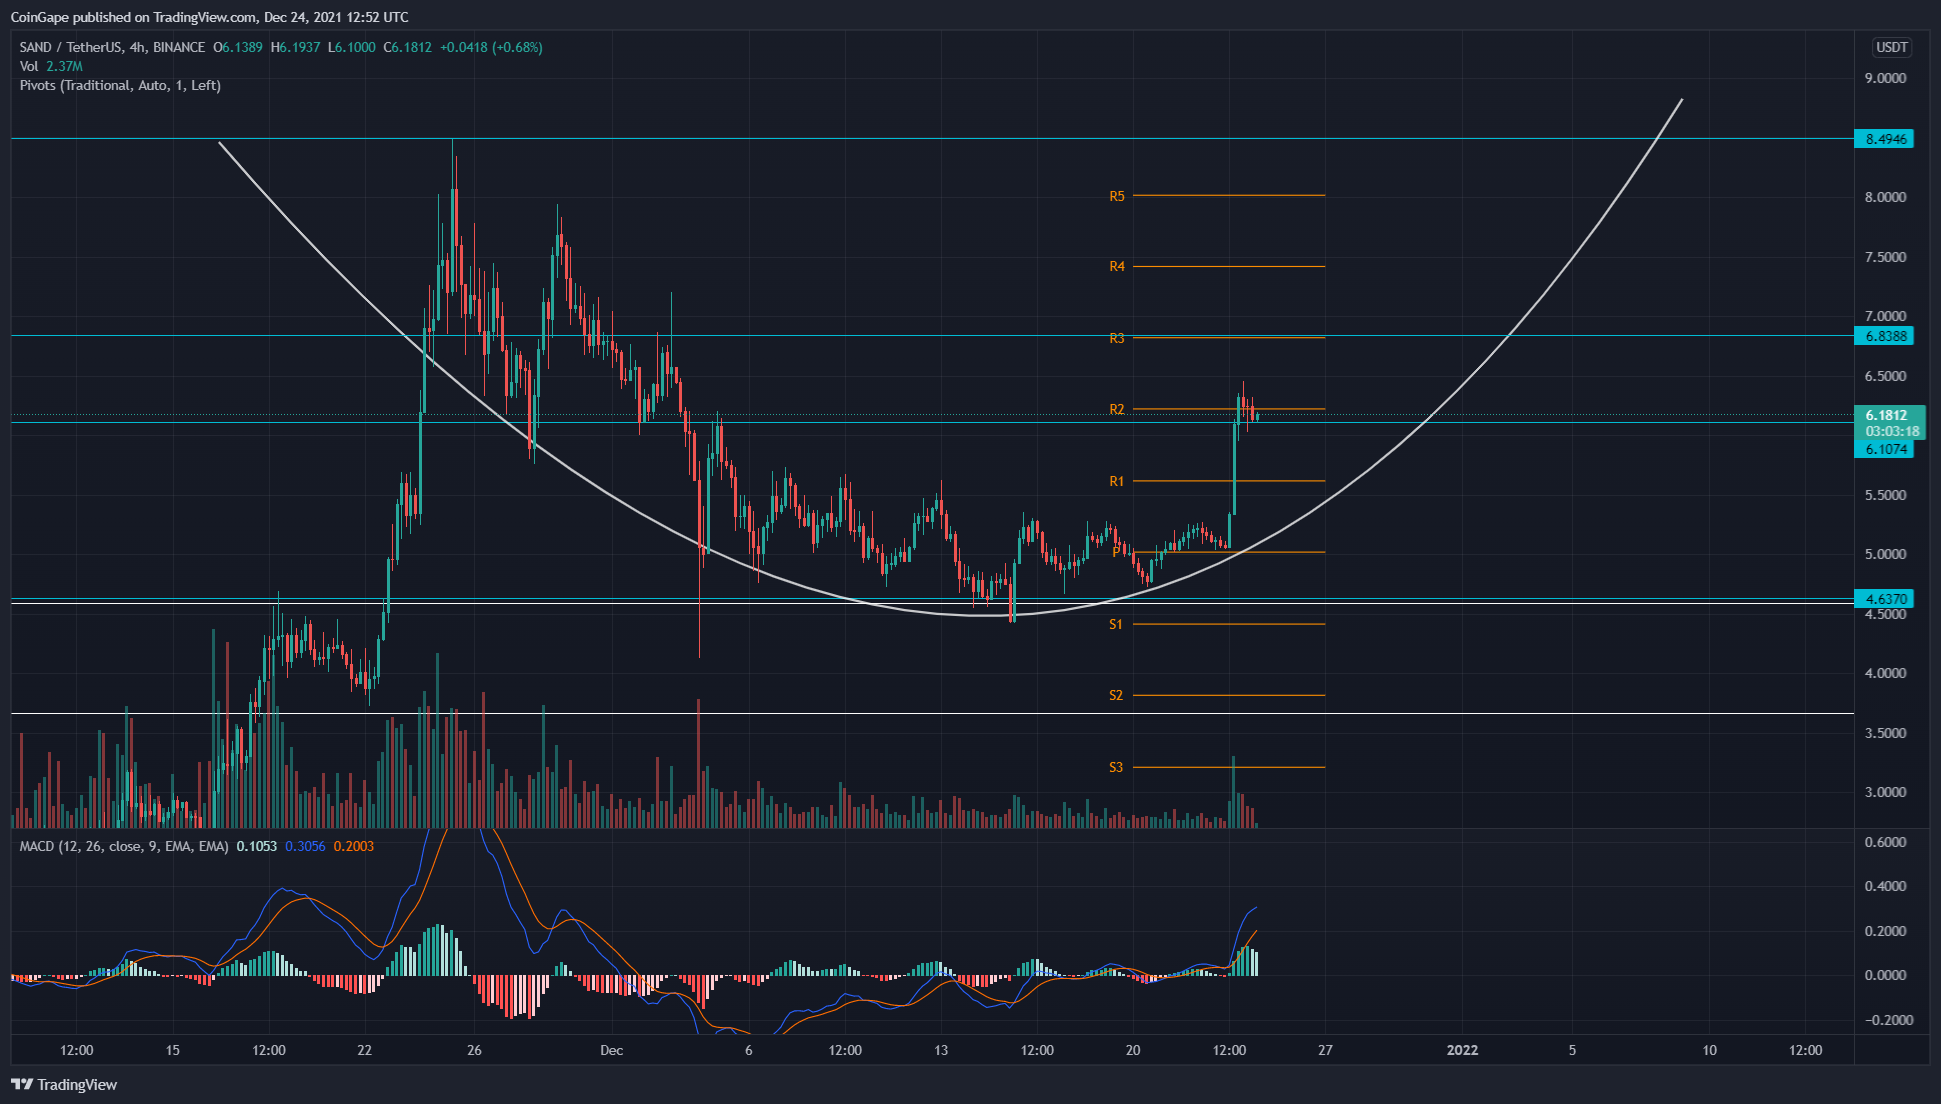 Source- Tradingview
The SAND token chart revealed a rounding bottom pattern in the 4-hour time frame chart from this whole structure of retracement and recovery. The neckline for this pattern is also the All-Time High level, i.e., 48.5, and following the pattern, the price should soon rally to this milestone.
However, as mentioned, the price broke out from the $6.1 mark and is currently going through a retest phase. The crypto traders can expect a retracement to the $6.1 or $5.75 mark, which would confirm the demand pressure for continuing its rally.
The traditional pivot levels indicate the traders will expect to meet their next resistance level at $6.8 and $704. For the opposite end, the support levels are $5.6 and $5.

Why Trust CoinGape
CoinGape has covered the cryptocurrency industry since 2017, aiming to provide informative insights Read more… to our readers. Our journal analysts bring years of experience in market analysis and blockchain technology to ensure factual accuracy and balanced reporting. By following our Editorial Policy, our writers verify every source, fact-check each story, rely on reputable sources, and attribute quotes and media correctly. We also follow a rigorous Review Methodology when evaluating exchanges and tools. From emerging blockchain projects and coin launches to industry events and technical developments, we cover all facets of the digital asset space with unwavering commitment to timely, relevant information.

Delivered every day.
- Insights that move markets
- 100,000 active subscribers


- CLARITY Act Odds Slump as Bank Reps Review Stablecoin Yield Compromise Text
- XRP News: RLUSD Hits $1.5B Market Cap As Ripple Tests Stablecoin in Singapore
- Bitcoin Steady as US-Iran Peace Talks in Limbo amid New Strikes, Military Deployment
- Elon Musk’s SpaceX Could File for IPO This Week, Tokenized Stock Falls
- Bitget Blends Crypto Trading With MotoGP Brazil Fan Experience Push
- Will Trump’s 5-Day Pause on Strikes Against Iran Surge Bitcoin and XRP Price?
- CLARITY Act Prediction 2026: Expected Timeline for Passage and Its Impact on Crypto Prices
- Dogecoin, Shiba Inu, and Pepe Coin Price Outlook as Markets Rise on U.S.–Iran Temporary Pause
- Bittensor (TAO) Price Soars 80% MoM Outperforming Bitcoin- Is It A Good Time to Buy?
- Top Factors Behind Shiba Inu (SHIB) Price Surging Today
- Gold Vs BTC: Bitcoin Outperforms Gold by 23% – Is $75K Next Amid Trump’s Five Day Pause


