


Litecoin Price Prediction: LTC Price Escapes Falling Wedge Pattern With Bullish Breakout


The LTC/USD technical chart indicates a short-term downtrend. The coin initiated a minor correction in mid-November, which extended more than the expectation of several crypto analysts. The price has plummeted to $140, where it resonates in a short-range, preparing for its next move.
LTC/USD Daily Time Frame Chart
 Source- Tradingview
Past Performance or Trend
The past three months have been a roller coaster ride for the LTC coin as the new correction phase has nullified all the gains the coin gathered in October and early November. The price has lost around 51% from the previous top of $296 and is currently hovering above the $141 support.
Bullish RSI Divergence Hints An Upward Rally For LTC
For the past three weeks, the LTC coin price has been resonating between the $166.5 and $141 mark, creating a narrow range in this chart. Such consolidation phase brings an excellent trending opportunity for traders when the price breaches either of the borderlines.
Furthermore, the coin also reveals a falling wedge pattern in the 4-hour time frame chart. On December 19th, the price gave a decisive breakout from the resistance trendline, indicating a better chance for the price to challenge the overhead resistance of $166.5.
The current price of the LTC coin is $159, with an intraday gain of 4.04%. The 24-hour volume change is $1.55 Billion, indicating a 60% hike. As per Coinmarketcap, the coins stand at 18th rank with their current market cap of $10,686,132,291 (+4.09).
LTC/USD 4-hour Time Frame Chart
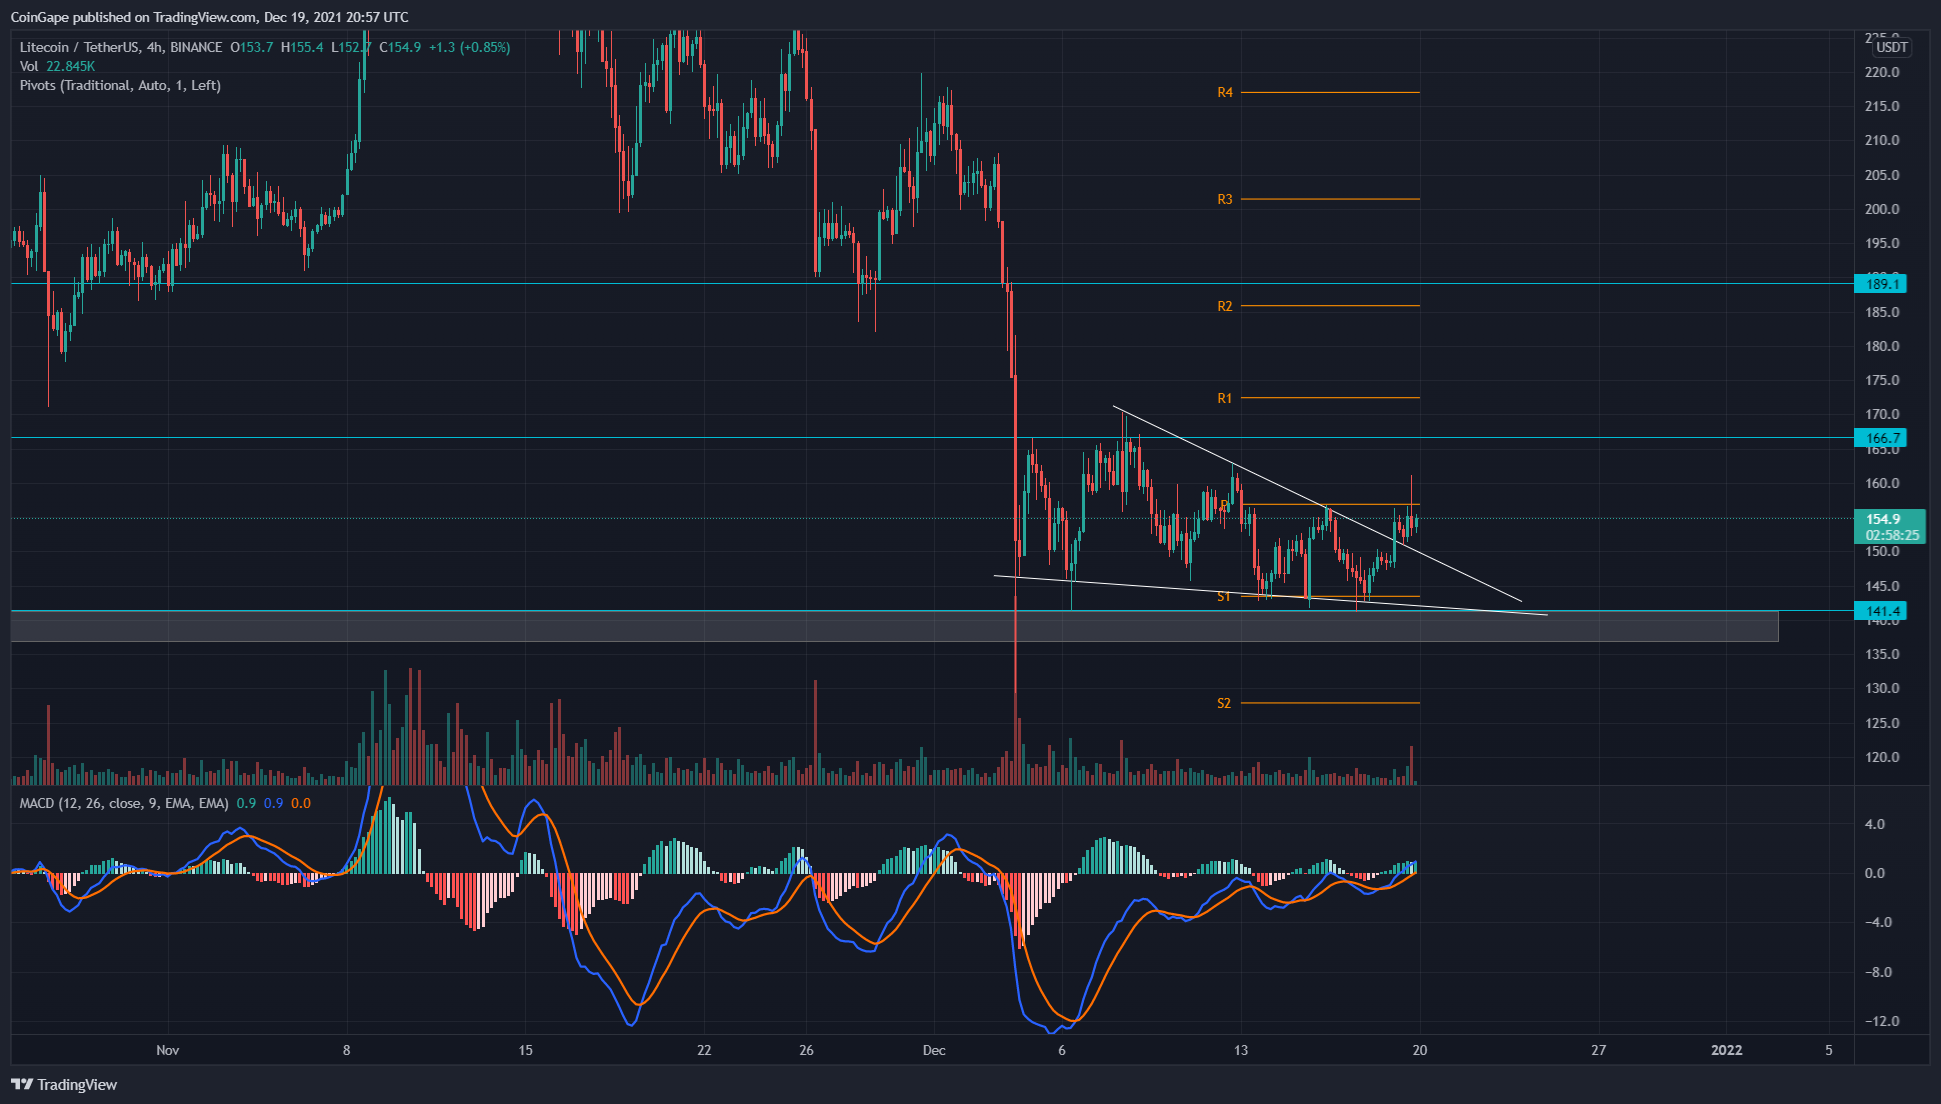 Source- Tradingview
Technical Indicators
-The daily Relative Strength Index (41) displays an evident bullish divergence in its chart, indicating the growing strength of coin buyers.
-The LTC coin price is moving below the crucial EMAs (20, 50, 100, and 200), indicating the major trend is still bearish. Moreover, the chart also shows a death crossover of the 50 and 200 EMA
-As per the traditional pivot levels of the 4-hr chart, the coin traders can expect the nearest resistance for the LTC price at $157, followed by $172. As for the flip side, the support levels are $143.5 and $128.5.
Why Trust CoinGape
CoinGape has covered the cryptocurrency industry since 2017, aiming to provide informative insights Read more… to our readers. Our journal analysts bring years of experience in market analysis and blockchain technology to ensure factual accuracy and balanced reporting. By following our Editorial Policy, our writers verify every source, fact-check each story, rely on reputable sources, and attribute quotes and media correctly. We also follow a rigorous Review Methodology when evaluating exchanges and tools. From emerging blockchain projects and coin launches to industry events and technical developments, we cover all facets of the digital asset space with unwavering commitment to timely, relevant information.


Delivered every day.
- Insights that move markets
- 100,000 active subscribers


