
How Close Is Solana Price to $70 With the Fear & Greed Index at 19?



Highlights
- Solana price could revisit $78 if $80 support gives way.
- The Fear and Greed Index signaled extreme fear at 19.
- U.S. spot Solana ETFs recorded $1.92 million in net outflows.
Solana price hovered near $81.45 on Friday, down about 10% over seven days amid a broader crypto selloff. Reaching $60 would require another $21.45 drop, or 26.3% from that level.
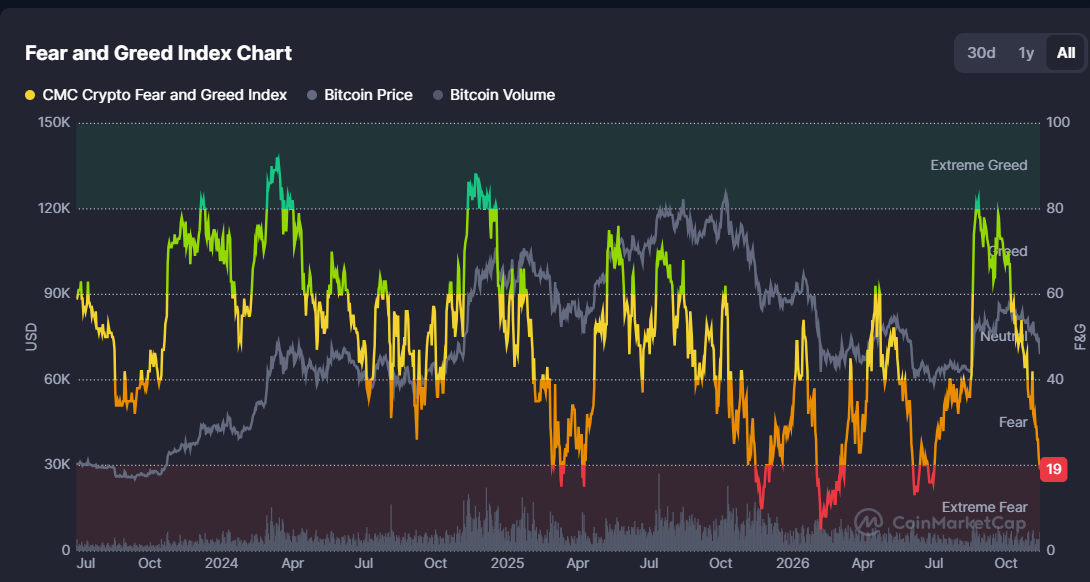
The Crypto Fear and Greed Index registered 19 out of 100, putting sentiment in its extreme fear category. Total crypto market value fell 2.58% over 24 hours to about $2.35 trillion.
Bitcoin led the decline, falling 5.07% to around $69,300, nearly double the broader market’s percentage loss. The drop pushed Bitcoin below $70,000 and left it down nearly 6% for the week. Ether fell below $2,000, while XRP continued its slide toward $1.
Exchanges liquidated about $676 million in Bitcoin positions over 24 hours. Long positions, which bet on higher prices, accounted for roughly $637 million, or 94% of the total. The forced closures added to selling pressure because exchanges had to sell contracts backed by insufficient collateral.
U.S. Producer Prices Rise Less Than Forecast
U.S. producer prices rose 6.5% from a year earlier in October, accelerating from 6.3% in September. The figure fell short of the 6.6% forecast, three days after consumer inflation came in hotter than expected.
BREAKING: October PPI Inflation rises to 6.5%, its highest level since November 2022.
Core PPI Inflation was 5.0%, in-line with expectations of 5.0%.
CPI, PPI, and PCE inflation continue to push higher in the US.
All signs point toward a December rate hike.
— The Kobeissi Letter (@KobeissiLetter) November 13, 2026
Traders saw an 89% chance the Fed would raise rates by 25 basis points in December, up from 76%. The softer reading could ease concerns about a 50 basis point hike and give stocks and Bitcoin some relief.
U.S. Spot Solana ETFs Record $1.92 Million in Net Outflows
The U.S. spot Solana ETF market recorded $1.92 million in net outflows on November 12, according to SoSoValue. Fidelity’s FSOL saw $3.61 million in net withdrawals, while Bitwise’s BSOL drew $1.69 million in net inflows.
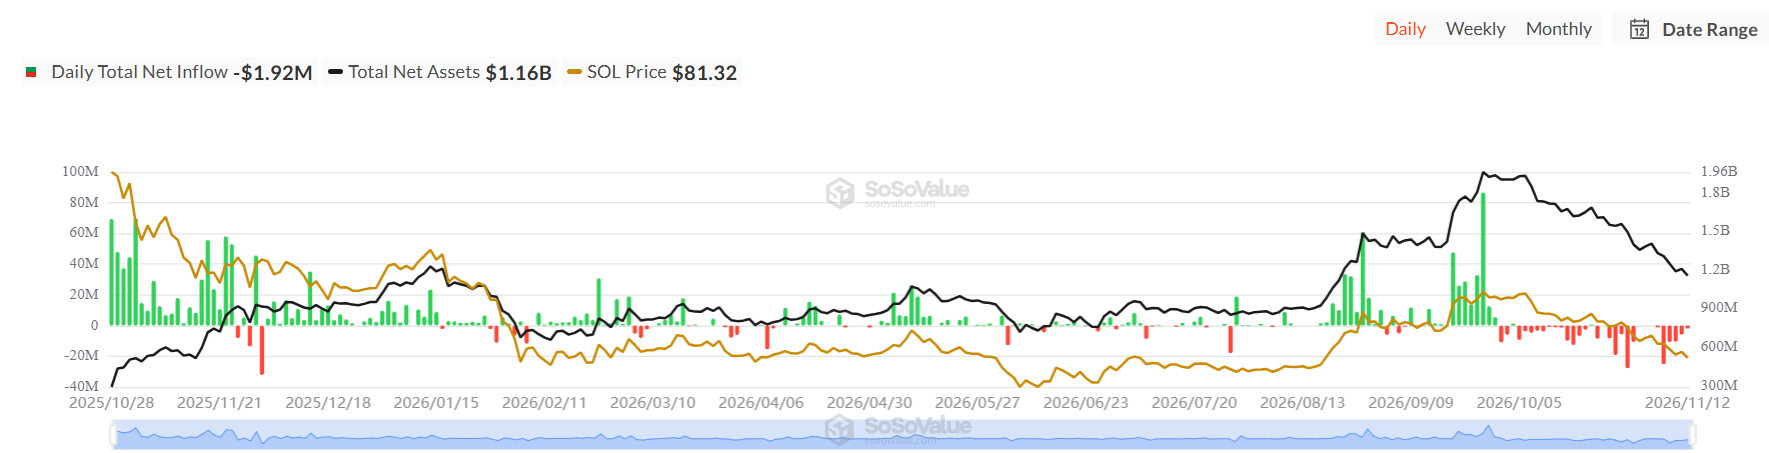
Investors traded $48.90 million worth of ETF shares during the session, and cumulative net inflows stood at $1.41 billion. The funds held $1.16 billion in net assets, equivalent to 2.41% of Solana’s total market capitalization.
Could Solana Price Drop to $70 if $80 Support Breaks?
At the time of writing, the SOL price traded at $80.56, down 0.14% in the latest four-hour candle. TradingView showed Solana reclaiming $80 after briefly slipping below that level on November 13.
The relative strength index rebounded from oversold territory to 35.58, still below its midpoint of 50. Chaikin Money Flow stood at −0.10, pointing to continued selling pressure.
If $80 holds, the future Solana price outlook could retest the latest candle’s $82.38 high before challenging $85. A break above $85 would bring $90 into focus, a level where Solana previously found support.
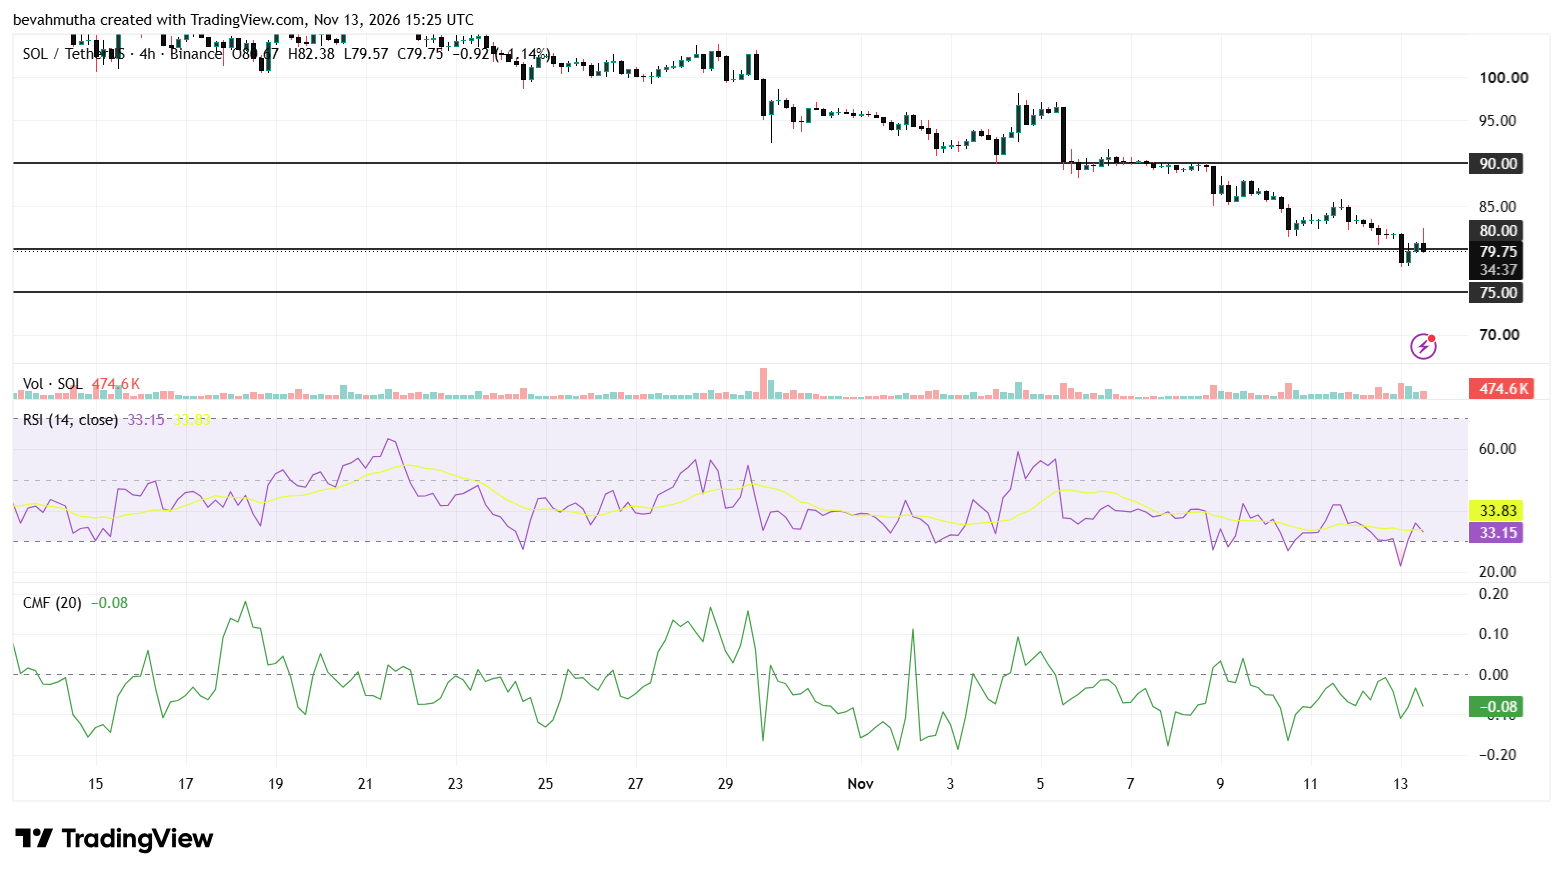
A four-hour close below $80 could lead to a retest of the recent low near $78. A break below that low would expose the next marked support at $75.
Instant Currency Exchange at BestChange with Ease
- Compare Rates Across 1000+ Exchanges
- Access 250+ Cryptocurrencies & Pairs
- Save Time with Real-Time Price Tracking
- Trusted & Verified Exchange Listings

Frequently Asked Questions (FAQs)
1. Why did Solana’s price fall?
2. How did October U.S. producer inflation compare with forecasts?
Why Trust CoinGape
CoinGape has covered the cryptocurrency industry since 2017, aiming to provide informative insights Read more…to our readers. Our journal analysts bring years of experience in market analysis and blockchain technology to ensure factual accuracy and balanced reporting. By following our Editorial Policy, our writers verify every source, fact-check each story, rely on reputable sources, and attribute quotes and media correctly. We also follow a rigorous Review Methodology when evaluating exchanges and tools. From emerging blockchain projects and coin launches to industry events and technical developments, we cover all facets of the digital asset space with unwavering commitment to timely, relevant information.




Delivered every day.
- Insights that move markets
- 100,000 active subscribers

CRYPTO IMPACT AWARDS 2026