



Solana Price Prediction: Is $60 Next? SOL ETF Outflows Hit 6 Weeks, Fear & Greed at 12



Highlights
- Solana price rebounded to $71.26 after touching a $67.41 weekend low.
- Solana ETFs shed $32.05 million in their sixth outflow week.
- A sustained break below $65 could put $60 in focus.
Solana price traded at $71.26 on November 16 after sliding to $67.41, its lowest level since late June.
The four-hour chart showed SOL holding just above $70 after the weekend selloff. Earlier Monday, SOL price was down 16.84% over the past seven days, with monthly losses reaching 31.87%.
Crypto Market Slides as Fear and Greed Index Hits 12
CoinMarketCap’s Fear and Greed Index stood at 12 on Monday, a reading that signals extreme fear. The index uses inputs such as volatility, price momentum and options positioning to gauge sentiment. The combined value of the crypto market fell 3.73% to about $2.18 trillion.
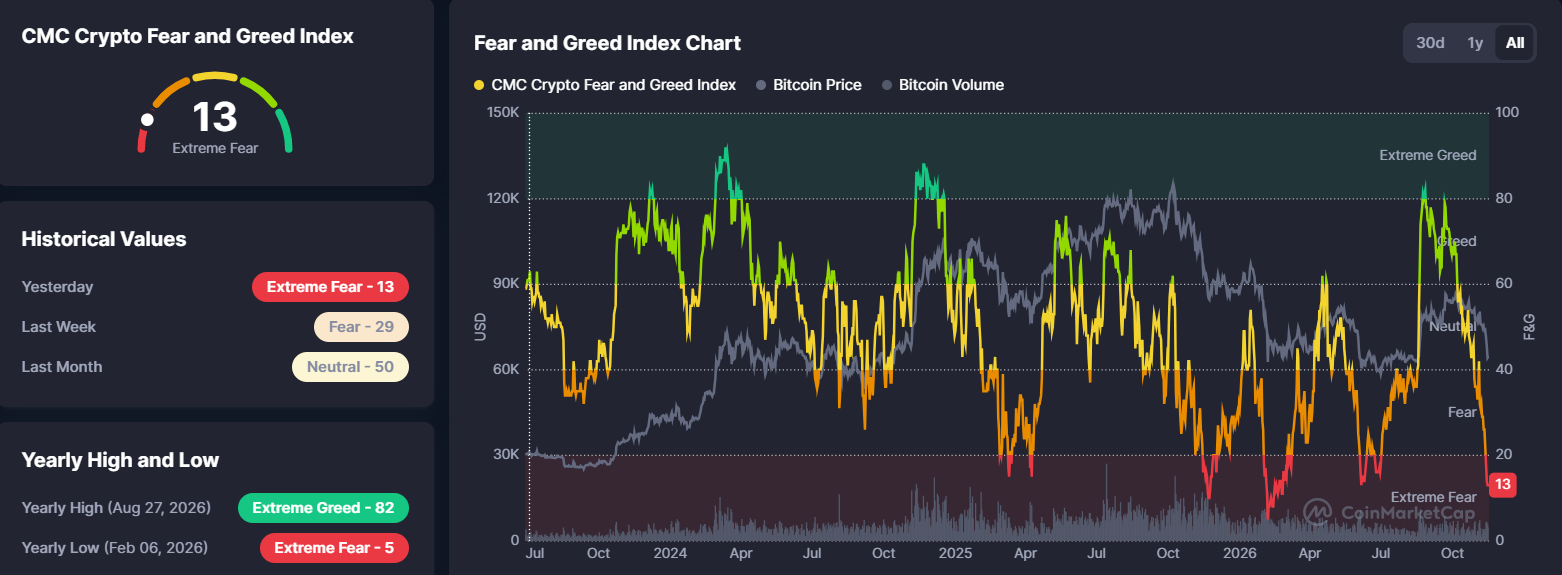
Bitcoin price traded near $65,000 after losing more than 10% the previous week. Its weekend slide took it close to $62,000, a level last seen in July. Ether gained about 2% during Monday trading after falling more than 12% the prior week. XRP price changed hands near $0.959 after touching a yearly low of $0.893 last week.
Solana ETF Outflows Extend to Six Weeks
US spot Solana ETFs lost $32.05 million to net redemptions in the week ended November 13, SoSoValue data showed. The six-week tally reached roughly $197.4 million after the funds had attracted fresh money for 14 straight weeks.
Each of last week’s five sessions ended with net redemptions across the funds. Farside Investors recorded $13.4 million in outflows on Tuesday, including $8.2 million from Bitwise’s BSOL. Net withdrawals reached $5.9 million on Wednesday across funds from Fidelity and Morgan Stanley. Fidelity’s FSOL accounted for all $3.1 million in net outflows on Friday.
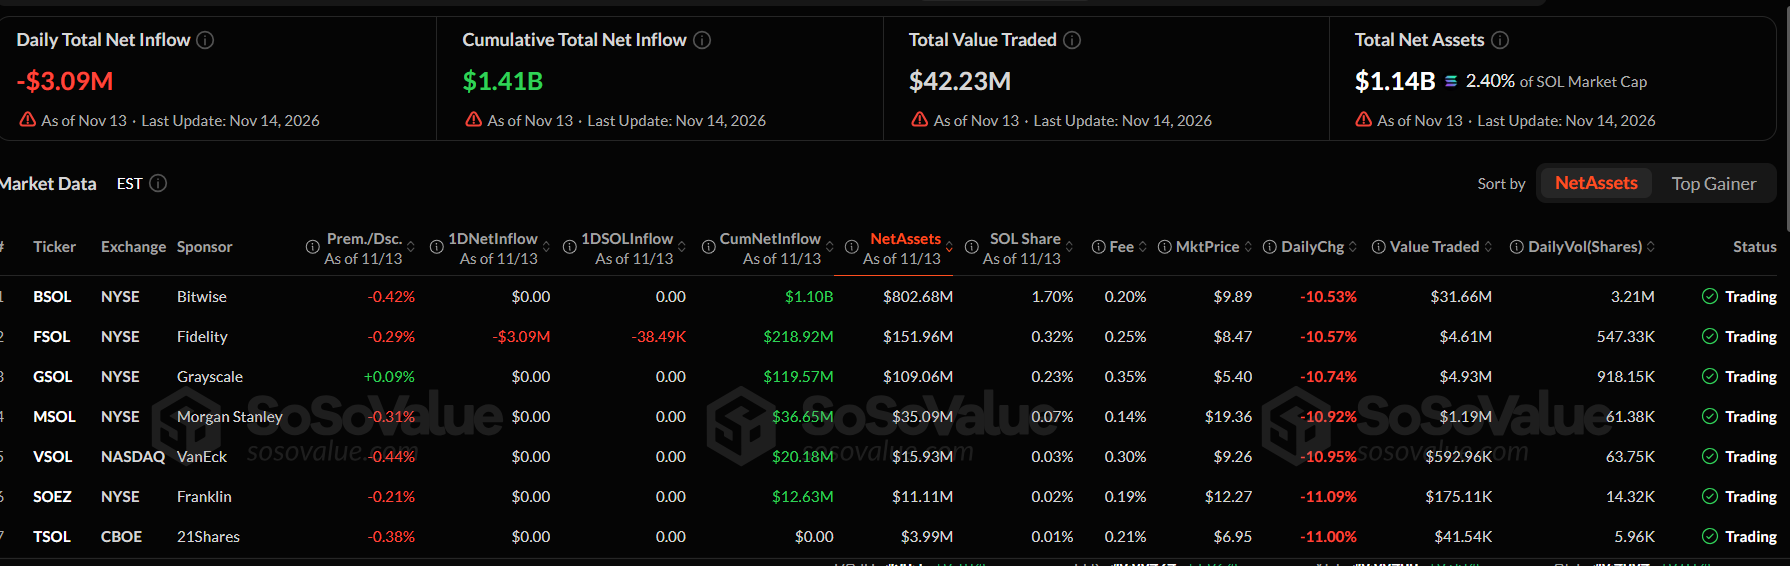
SoSoValue tracked $24.82 million in net outflows on October 27 and 28, ahead of Solana’s break below $100. Farside’s cumulative total remained positive at about $1.4 billion through Friday. Bitwise’s fund made up the largest share, with nearly $1.1 billion in cumulative net inflows.
Will Solana Price Crash to $60?
The four-hour chart puts immediate support at $70, where buyers stepped in again after the weekend slide. A close below $70 would expose the $67.41 low, with $65 next if that level gives way. If sellers break $65, the next downside target is $60, about 15.8% below the $71.26 Solana price.
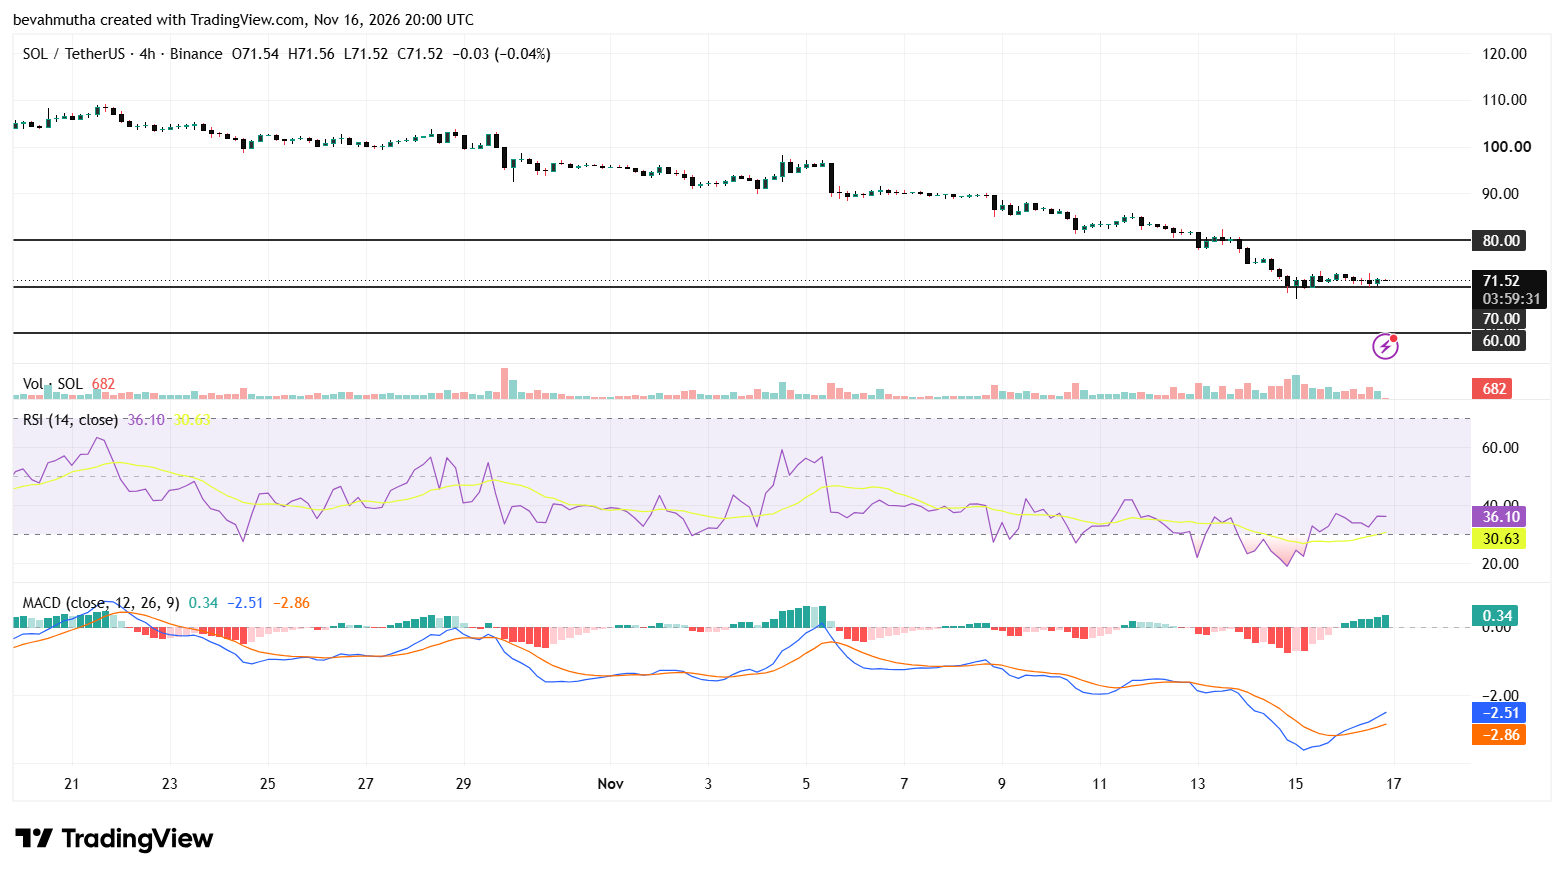
The four-hour relative strength index rose to 34.81, clearing the oversold threshold of 30. The reading was still below the neutral 50 mark, suggesting that sellers retained control of short-term momentum.
The MACD line rose to −2.68, above its signal line at −2.95. The positive 0.27 histogram suggests selling momentum is easing, while both lines remain below zero. Successive lower highs on the four-hour chart point to a continuing downtrend. A sustained break above $75 would put $80 in view, where former support could act as resistance.
Instant Currency Exchange at BestChange with Ease
- Compare Rates Across 1000+ Exchanges
- Access 250+ Cryptocurrencies & Pairs
- Save Time with Real-Time Price Tracking
- Trusted & Verified Exchange Listings

Frequently Asked Questions (FAQs)
1. What does a Fear and Greed Index reading of 12 mean for SOL’s market backdrop?
2. Where do cumulative Solana ETF flows stand after the withdrawals?
Why Trust CoinGape
CoinGape has covered the cryptocurrency industry since 2017, aiming to provide informative insights Read more…to our readers. Our journal analysts bring years of experience in market analysis and blockchain technology to ensure factual accuracy and balanced reporting. By following our Editorial Policy, our writers verify every source, fact-check each story, rely on reputable sources, and attribute quotes and media correctly. We also follow a rigorous Review Methodology when evaluating exchanges and tools. From emerging blockchain projects and coin launches to industry events and technical developments, we cover all facets of the digital asset space with unwavering commitment to timely, relevant information.




Delivered every day.
- Insights that move markets
- 100,000 active subscribers

CRYPTO IMPACT AWARDS 2026