

Compounding vs Drawdown: The Math Active Traders Often Underestimate



Crypto never waits for a review point. Prices move through nights and weekends, so a strong week can become a sharp drawdown before exposure is reassessed. That exposes a flaw in many projections: the chart compounds steadily while the market delivers uneven gains, losses and costs.
The arithmetic of compounding trading returns is simple. The path required to achieve them is not. Higher potential returns generally carry greater loss potential, as MoneyHelper’s high-risk investment guidance notes. A realistic model must show adverse periods, not only reinvested gains.
Why Smooth Growth Charts Can Be Misleading
A smooth curve repeats a fixed calculator input. It explains arithmetic while removing the volatility, timing and changing exposure of active markets.
The Difference Between a Formula and a Market Path
The standard formula is starting balance × (1 + return rate) raised to the number of periods. In a hypothetical example, $10,000 compounded at exactly 2% monthly for 12 months becomes about $12,682.
This assumes every month is positive, the rate never changes and there are no fees, taxes, deposits or withdrawals. It is an illustration, not an expected outcome.
For readers comparing the same mathematics across currency trading, The Forex Complex provides a calculator for testing hypothetical starting balances, return assumptions and periods. Its output should be treated as a scenario, not a forecast or statement of probability.
Why Crypto Makes Path Dependence Easy to See
Crypto’s 24/7 structure allows large moves without a weekly close. Leverage-based liquidation, cash flows and changing position sizes can interrupt a projected path.
A 2026 CryptoPotato report on Coinbird’s Bitcoin DCA analysis paired a strong historical terminal value with a reported 76.72% maximum drawdown. Its methodology excluded fees and taxes. The useful lesson is that headline growth and the path endured to reach it belong in the same calculation.
What Compounding Actually Does
Compounding means each percentage return applies to a changing balance. It can accelerate growth when returns are positive, but also changes the capital exposed to the next loss.
In a hypothetical, cost-free sequence, $10,000 gaining 10% becomes $11,000. A second 10% gain produces $1,100, leaving $12,100 because the first gain joined the capital base.
If that balance then loses 10%, the dollar loss is $1,210. Position sizing can keep planned risk proportional, but a fixed percentage represents more money after growth.
The phrase compound interest trading is convenient shorthand, although active trading does not normally pay a fixed rate. Returns vary, and negative periods belong to the same multiplicative process.
Drawdown Recovery Is Not Symmetric
Drawdown measures the decline from a previous peak. Recovery is asymmetric because the required gain is calculated from the smaller balance left after the loss.
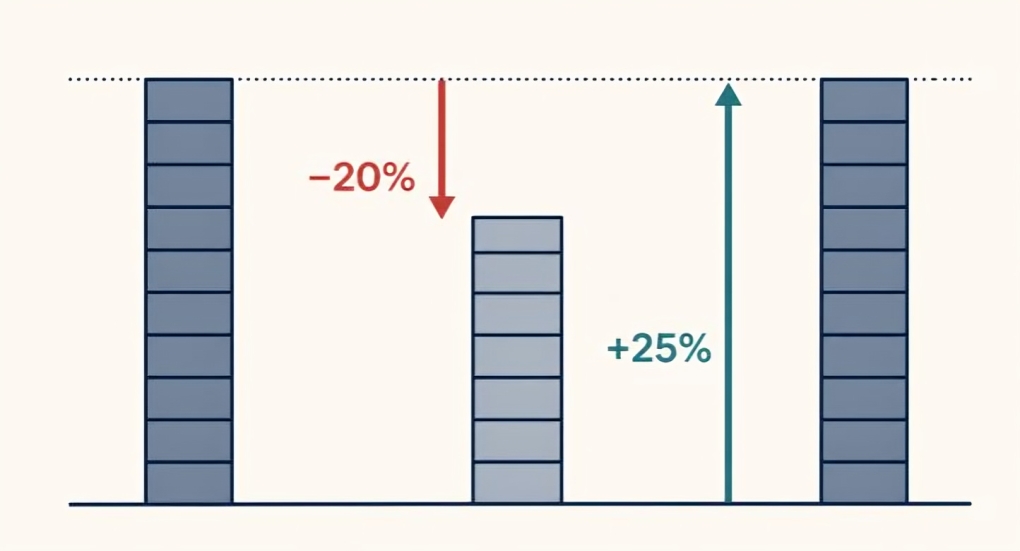
In a hypothetical $10,000 account, a 20% loss leaves $8,000. A subsequent 20% gain reaches only $9,600. Full recovery requires 25%: the missing $2,000 divided by the remaining $8,000.
The general trading drawdown recovery formula is drawdown ÷ (1 − drawdown). The table assumes no cash flows, fees or further losses.
| Hypothetical drawdown | Capital remaining from $10,000 | Gain required to regain the peak |
| 20% | $8,000 | 25.0% |
| 30% | $7,000 | 42.9% |
| 50% | $5,000 | 100.0% |
| 70% | $3,000 | 233.3% |
A useful drawdown trading report should show depth and duration, not merely whether a strategy eventually recovered in a backtest.
Fees, Slippage and Trading Frequency Change the Curve
Compounding works on net returns. Every commission, spread, funding charge and unfavourable fill reduces the balance available for the next period.
Consider a simplified hypothetical $10,000 account without cash flows or taxes. At 1% gross monthly for 12 months, it reaches about $11,268. If friction reduces the net rate to 0.75%, it reaches about $10,938, roughly $330 less.
More trades create opportunities, but also more friction and execution risk. A hypothetical 10% loss followed by a 10% gain leaves 99% of the starting capital before costs. Increasing frequency does not remove that volatility drag.
A strategy should therefore be judged on risk-adjusted returns, not trade count. A compound growth calculator produces clean outputs only because its inputs are clean; omitting costs makes that precision misleading.
Cross-Market Scenario Planning: Crypto and Forex
The formula is universal, but market structure determines which assumptions need stress. Crypto trades continuously and adds venue, custody, weekend liquidity and liquidation risks.
Forex is largely an over-the-counter, 24/5 market. The BIS measured OTC FX turnover at $9.6 trillion per day in April 2025, but scale does not remove retail leverage or execution risk.
A crypto case might include sharp weekend moves, funding and exchange downtime. A currency case might include rollover, news-event spread widening and five-day trading weeks.
The purpose is not to identify which market compounds “better”. It is to see how each strategy behaves when its own costs and loss patterns are included.
How to Build a More Honest Compounding Scenario
Begin with a question, not a desired balance. One strong month is a poor long-term input, so use a broad, verified record with a conservative adjustment.
Do not simply reduce every month by the same amount. Insert losing periods and variable costs. In a hypothetical six-period path of +6%, +4%, −8%, +3%, −5% and +7%, the arithmetic sum is +7%, but the compounded result is about +6.2% before fees.
Run at least three paths with identical starting capital and time horizon:
- Base: evidence-based return range, observed losing periods and realistic costs.
- Conservative: lower positive returns, higher costs and slower recovery.
- Adverse: an early severe drawdown, stressed liquidity and no assumed immediate rebound.
The model should also follow several guardrails:
| Input | Weak assumption | Stronger assumption |
| Return rate | Best recent month repeated | Historical evidence with a conservative haircut |
| Losing periods | None | Realistic losing weeks or months |
| Costs | Ignored | Fees, spreads, slippage and funding |
| Drawdown | Not modelled | An adverse drawdown and recovery case |
| Interpretation | Forecast | Hypothetical planning scenario |
What a Calculator Cannot Tell You
A calculator answers what happens if selected inputs occur. It cannot establish that those assumptions are reasonable, repeatable or probable.
The CFTC warns that AI and trading bots cannot predict sudden market changes and highlights unreasonable or guaranteed-return claims. Automation does not turn an assumption into evidence.
A favourable historical average may also come from one volatility regime, token cycle or liquidity environment. Stress tests, out-of-sample evidence and loss limits add context, but cannot guarantee future performance.
Final Thoughts: Model the Path, Not Just the Destination
Compounding is useful mathematics, not a smooth-growth promise. Active traders should ask what happens during losses, how close the account comes to a risk limit and what fees are removed.
Model upside, conservative and adverse paths under stated assumptions. If a scenario works only without drawdowns, costs or changing volatility, it describes an attractive destination while ignoring whether the account could survive the journey.


- Bitget Launches Open Custody Network, Giving Institutions Choice in Custody and Access to Markets
- ETHSpain 2026 Puts Infrastructure at the Center of Ethereum’s Next Chapter
- A 1960s-Style Evening Is Coming to TOKEN2049 Singapore, Courtesy of ChangeNOW
- Smart Money Signals vs Whale Tracking: What Solana Traders Should Actually Follow in 2026
- Bybit Users Can Now Fund Accounts in USD via OpenPayd