Crypto Market Update August 15: Solana Tops Weekly ETF Inflows as LINK, SHIB Surge



Highlights
- Crypto prices move in a tight range today amid weak trading volumes.
- Chainlink and Shiba Inu are defying the trend after rising by 5% and 2%, respectively.
- Solana led crypto market inflows this week as institutional demand returns.
The crypto market is moving in a narrow range today, August 15, albeit for a few altcoins such as Chainlink (LINK) and Shiba Inu (SHIB), which are up by 5% and 2%, respectively. Solana (SOL) is also down by 0.86% despite SOL ETFs recording the highest inflows in the week between August 10 and August 15.


What is Driving the Crypto Market Today?
Data from CoinMarketCap shows that all of the top ten largest cryptos by market cap have registered price gains or drops of less than 1%. The lack of meaningful gains aligns with typical weekend moves because of reduced trading volumes.
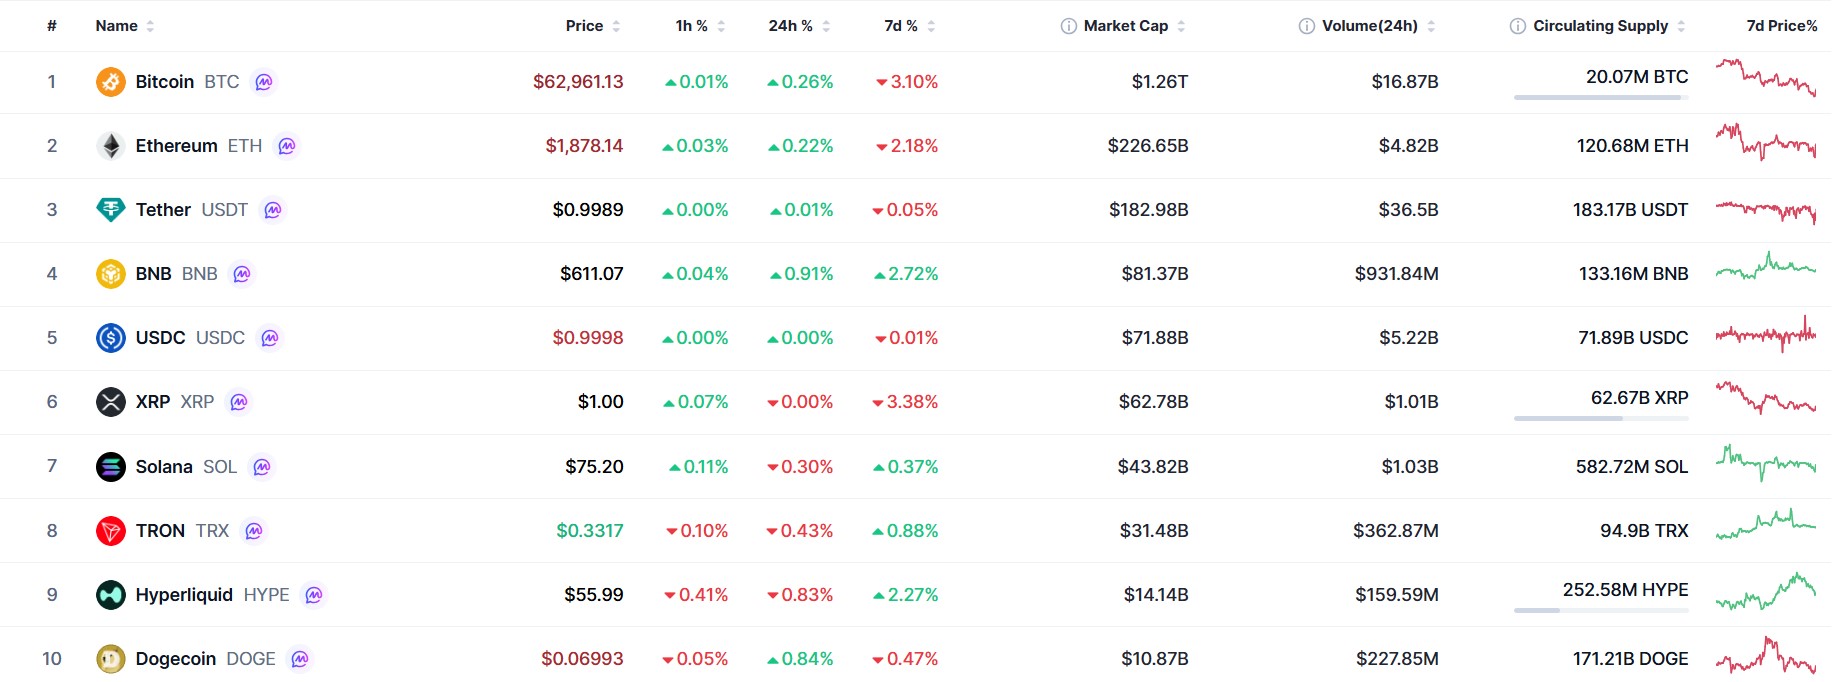
Bitcoin price has dropped to $62,000 amid $389 million in outflows from BTC ETFs. Ethereum has also dropped to $1,876 after ETH ETFs posted $2.26 million in outflows between August 10 and August 14.
Solana ETFs were the outliers during the week after the products recorded $10.26 million in inflows, with this being the highest among all crypto ETFs. The $10.26 million in inflows was also the highest seen by Solana ETFs since May.

The suppressed price moves in the crypto market today also come amid uncertainty around the US and Iran war. A recent report by CoinGape revealed that a drone attacked a ship at the Strait of Hormuz on August 14, marking another escalation in the war.
US Treasury Secretary Scott Bessent has also said the US will roll out an “economic isolation” plan on Iran, with crypto market traders watching to see whether Iran will retaliate to the threat.
Still, Chainlink is standing out with the biggest gains among altcoins of 5.17%. LINK’s trading volumes are also up by 120% today, August 15, to $492 million at the time of writing.
Shiba Inu price is also up by 2.09% to trade at $0.0000045 after a recent surge in the SHIB burn rate, driving optimism from traders that the meme coin’s network activity is rising again.


Crypto Market Data
- Total Crypto Market Cap: $2.16 trillion (+0.24%)
- 24-Hour Trading Volumes: $43.16 billion
- Bitcoin Price: $62,960 (+0.40%)
- Ethereum Price: $1,878 (+0.37%)
- XRP Price: $1 (+0.01%)
- Bitcoin ETF Flows (as of August 14): -$57.63 million
- Ethereum ETF Flows (as of August 14): $0
- Bitcoin Dominance: 58.4%
- Altcoin Season Index: 50/100
- Fear and Greed Index: 34 (Fear)
Derivatives Market Analysis
The total open interest across the crypto market is up slightly by 0.05% today, August 15, to $118.6 billion. The total derivatives trading volumes have also dropped by 20% to $126 million per data from CoinGlass.
The liquidations across the crypto market today have also dropped by 43% to $135 million, with $73 million being long liquidations and $61 million being short liquidations. Bitcoin stands out with the biggest liquidations of $15.3 million.

CoinGlass also shows that the derivatives market is leaning bullish today, with long volumes reaching $17.7 billion today, with this being higher than the short-selling volumes of $16.87 billion.
Solana Price Prediction as Bullish Pattern Emerges
The price of Solana has created a cup and handle pattern on the one-day chart. This pattern suggests that the uptrend that started on August 7 could continue after a brief pause.
But SOL needs to close above the resistance at $76 to confirm the bullish future Solana outlook shown by this bullish cup and handle pattern. If it makes this close, the price of SOL could gain by 8% and reach the July high of $82.
However, the AO bars that have turned red suggest that the bullish momentum is becoming weak, and this could hinder Solana’s move above the cup and handle’s resistance of $76.
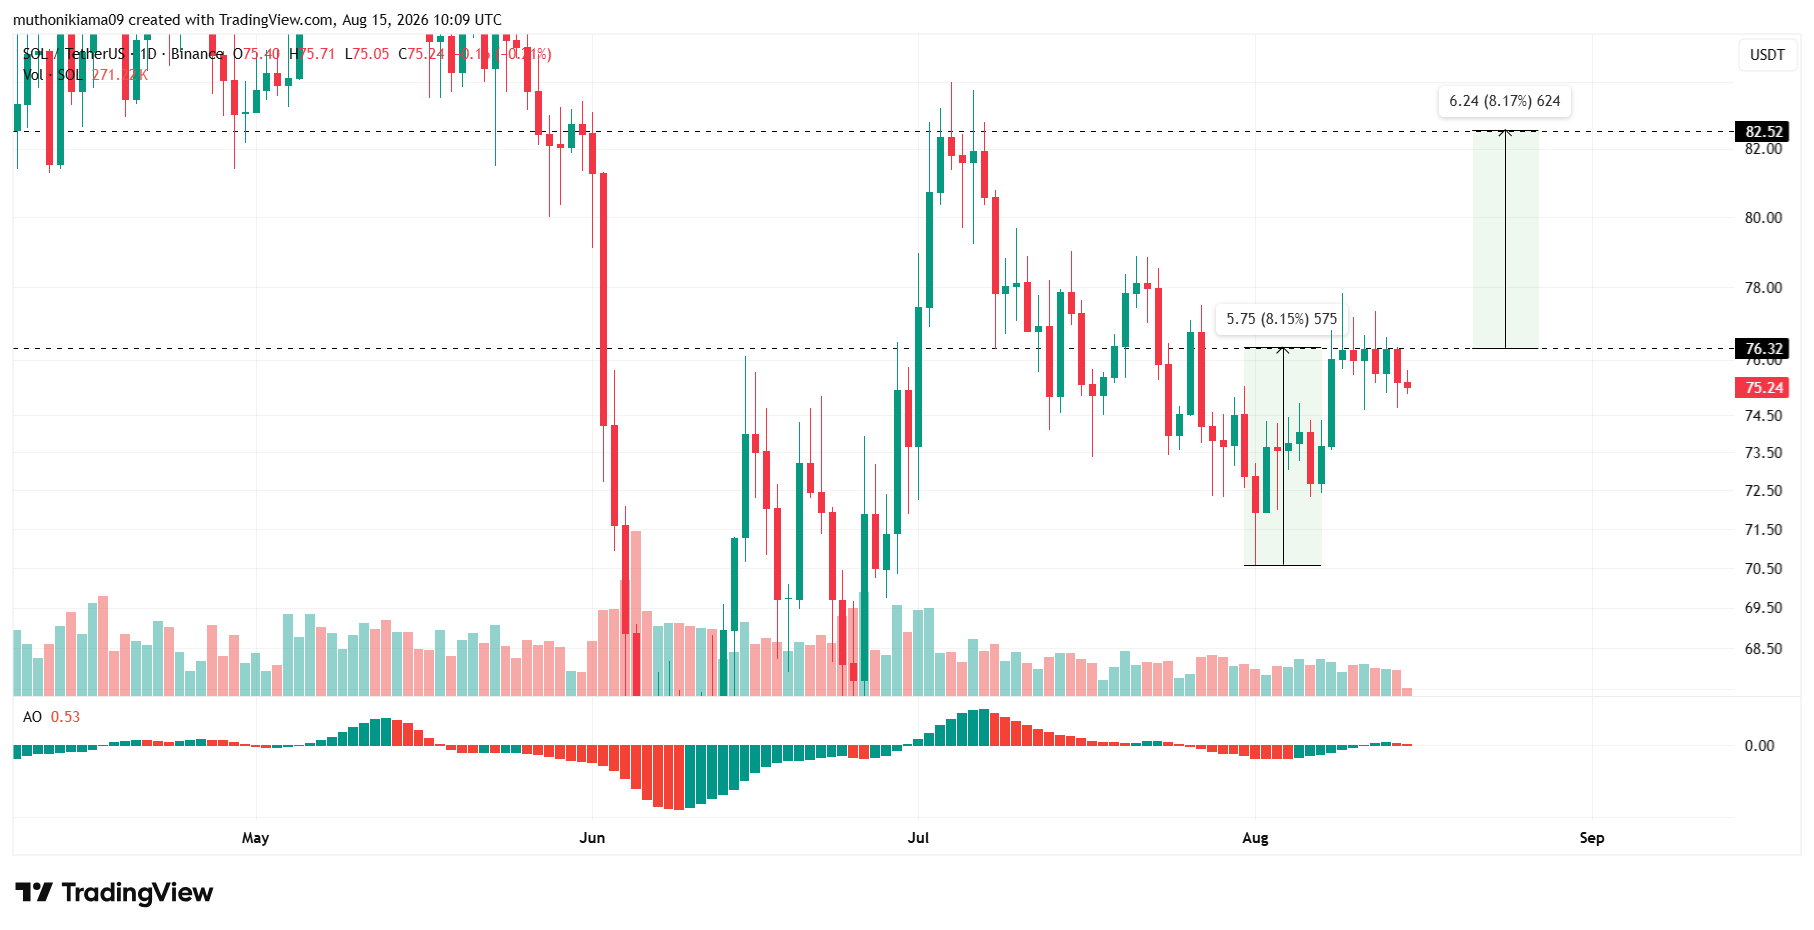
If the selling pressure seen in the last two straight days persists, Solana could also drop to the psychological support of $70.
LINK and SHIB Technical Outlook After Recent Gains
Chainlink is the biggest gainer in the crypto market today. These gains have pushed the price of LINK to the highest point since May, and the surging buying pressure suggests that the uptrend could continue.
LINK price will likely face an obstacle at $10 in its upward journey. If it closes above this resistance, the recent gains could continue. But if sellers begin to sell LINK at this resistance of $10, the price could drop to the support at $7.88.
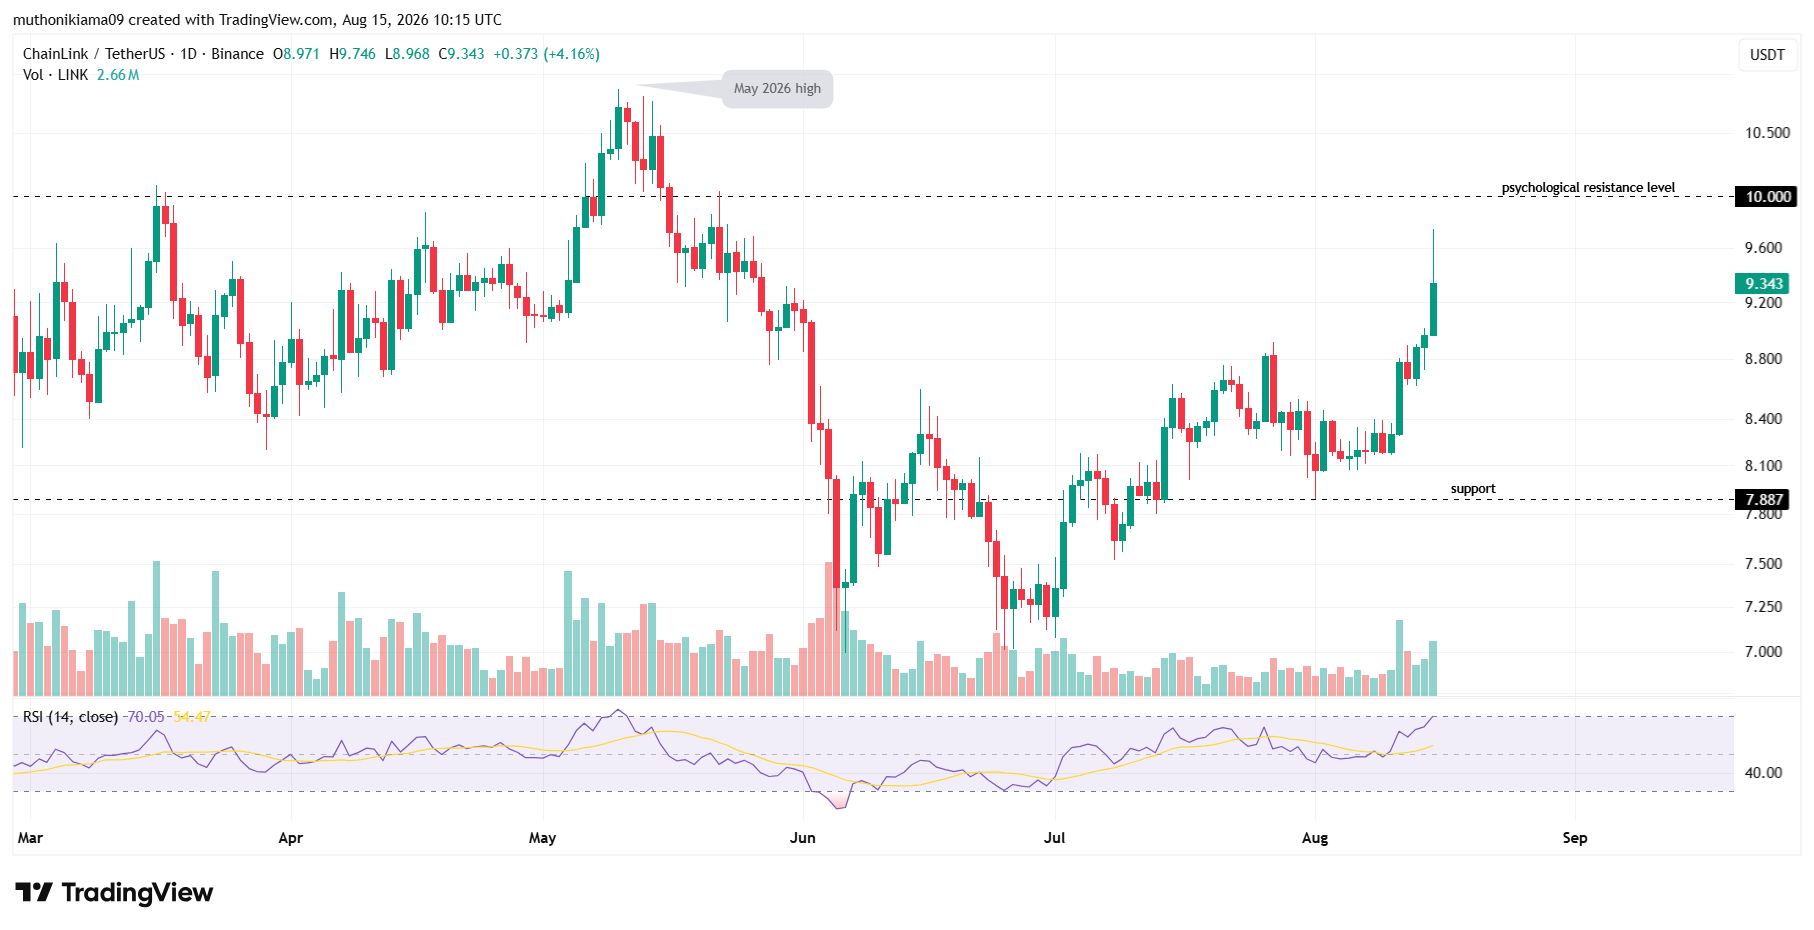
The RSI reading of 70 supports a bullish long-term Chainlink price outlook. It suggests that the momentum is favoring bulls and the gains could continue.
Shiba Inu price has also moved from $0.0000043 on August 13 to $0.0000045 on August 15. The gains come on the back of increasing activity in the derivatives market, with data from CoinGlass showing that SHIB’s futures volumes are up by 140% to $68 million.

A recent CoinGape Shiba Inu price analysis also noted that if Shiba Inu price closes above the resistance at $0.0000044, it could reach $0.00000477.
Shiba Inu’s gains come despite a decline in the total meme coin market cap by 3.66% today, August 15, to $22.12 billion. The total trading volumes for these crypto coins were also down by 10% to $1.41 billion.
Catch up on yesterday’s key developments and the coins that made the biggest moves in our Crypto Market Update August 14.
Instant Currency Exchange at BestChange with Ease
- Compare Rates Across 1000+ Exchanges
- Access 250+ Cryptocurrencies & Pairs
- Save Time with Real-Time Price Tracking
- Trusted & Verified Exchange Listings

Frequently Asked Questions (FAQs)
1. Why are LINK and SHIB prices up today?
2. Why are Solana ETF inflows rising?
Why Trust CoinGape
CoinGape has covered the cryptocurrency industry since 2017, aiming to provide informative insights Read more…to our readers. Our journal analysts bring years of experience in market analysis and blockchain technology to ensure factual accuracy and balanced reporting. By following our Editorial Policy, our writers verify every source, fact-check each story, rely on reputable sources, and attribute quotes and media correctly. We also follow a rigorous Review Methodology when evaluating exchanges and tools. From emerging blockchain projects and coin launches to industry events and technical developments, we cover all facets of the digital asset space with unwavering commitment to timely, relevant information.

24 Hours volume
$3.25B
Market Cap
$62.87B
Max Supply
NA



Delivered every day.
- Insights that move markets
- 100,000 active subscribers

Global ONCHAIN AWARDS 2026