IBIT vs FBTC Analysis: Which Bitcoin ETF Will Outperform?



Highlights
- BlackRock's IBIT dominates 61% of the entire Bitcoin ETF market.
- Fidelity's FBTC ETF trails at a far second with $11.30 billion in net assets.
- IBIT will likely continue to dominate the bitcoin ETF market if institutional inflows resume.
BlackRock launched the iShares Bitcoin Trust (IBIT) ETF on January 11, 2024, the same day that Fidelity launched its Fidelity Wise Origin Bitcoin Fund (FBTC). Despite launching on the same day, there is a huge gap between the two ETFs in terms of inflows, fees, and the assets under management (AUM).
BlackRock dominates other Bitcoin ETFs with the highest net assets of $47 billion, with Fidelity trailing at a far second with $11.30 billion in net assets.
IBIT’s dominance comes when institutional inflows towards Bitcoin ETFs could rise if the CLARITY Act gets approved before 2026 ends, hence the question: Can FBTC surpass IBIT in inflows and net assets, or will IBIT remain the biggest Bitcoin ETF on Wall Street?


A Deep Dive into BlackRock’s IBIT ETF
IBIT started trading 30 months ago, and it has already amassed $47.95 billion in net assets, which accounts for 61% of all the net assets accumulated by all 13 Bitcoin ETFs that trade in the US.
CoinGape also reported that the SEC has approved a filing by BlackRock for a Bitcoin Premium Income ETF.
BlackRock’s IBIT ETF has also recorded $62 billion in cumulative inflows since it was launched, and this is six times higher than the second-largest BTC ETF by net assets.
This ETF charges a fee of 0.25% to investors to seek exposure to Bitcoin through it, and it closed trading on June 18 at a price of $35. The June 18 closing price marks a 50% from the 52-week high of $71.
The dropping Bitcoin price has also affected the returns on IBIT, with BlackRock’s official data showing that holders have seen negative returns of 18% in one year. However, investors who have held since inception on January 11 have a return of 21%.
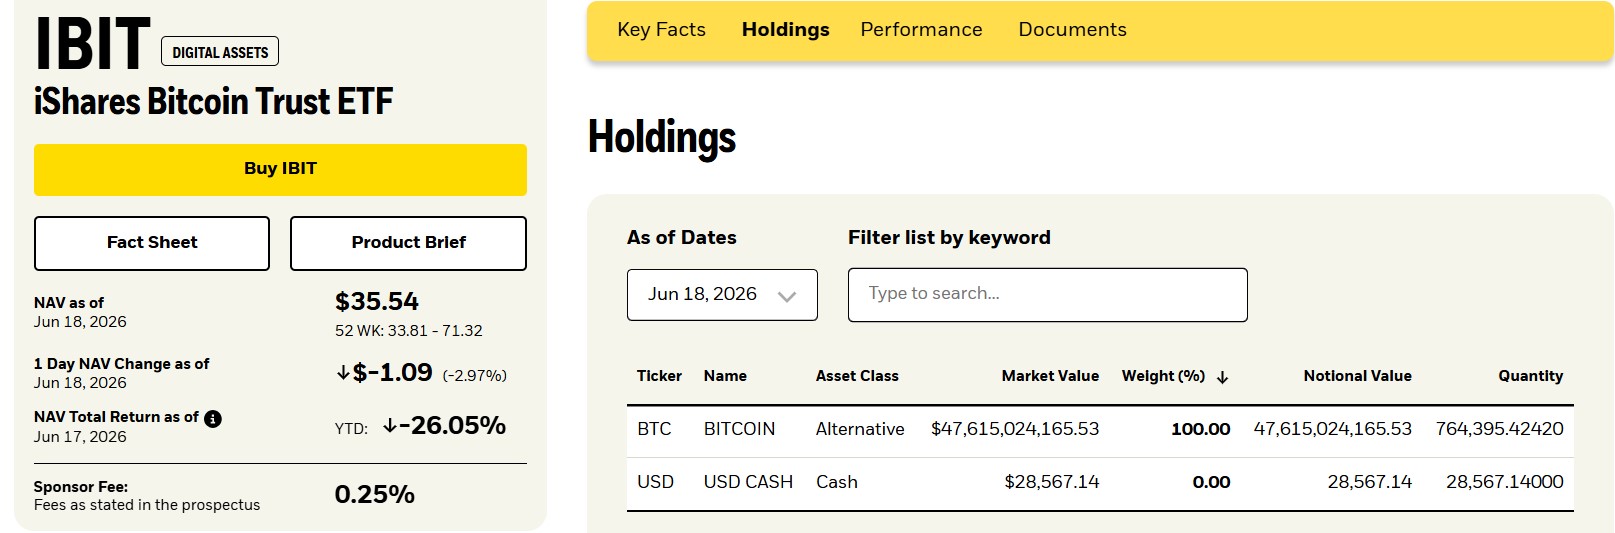
The chart above also shows that IBIT’s benchmark that compares the difference in performance with Bitcoin is at 0.27%, suggesting the ETF is giving almost the same returns as holding Bitcoin would.
IBIT’s Technical Analysis
IBIT’s daily chart shows that the ETF opened the year trading at $50, and the 30% drop that has been seen since then has led to IBIT establishing support at $34.
The RSI reading of 35 shows that the momentum is bearish, and IBIT might continue dropping if the price of Bitcoin does not register an upside.
However, this RSI reading of 35 suggests that sellers might soon become exhausted, and that would give IBIT room to recover.
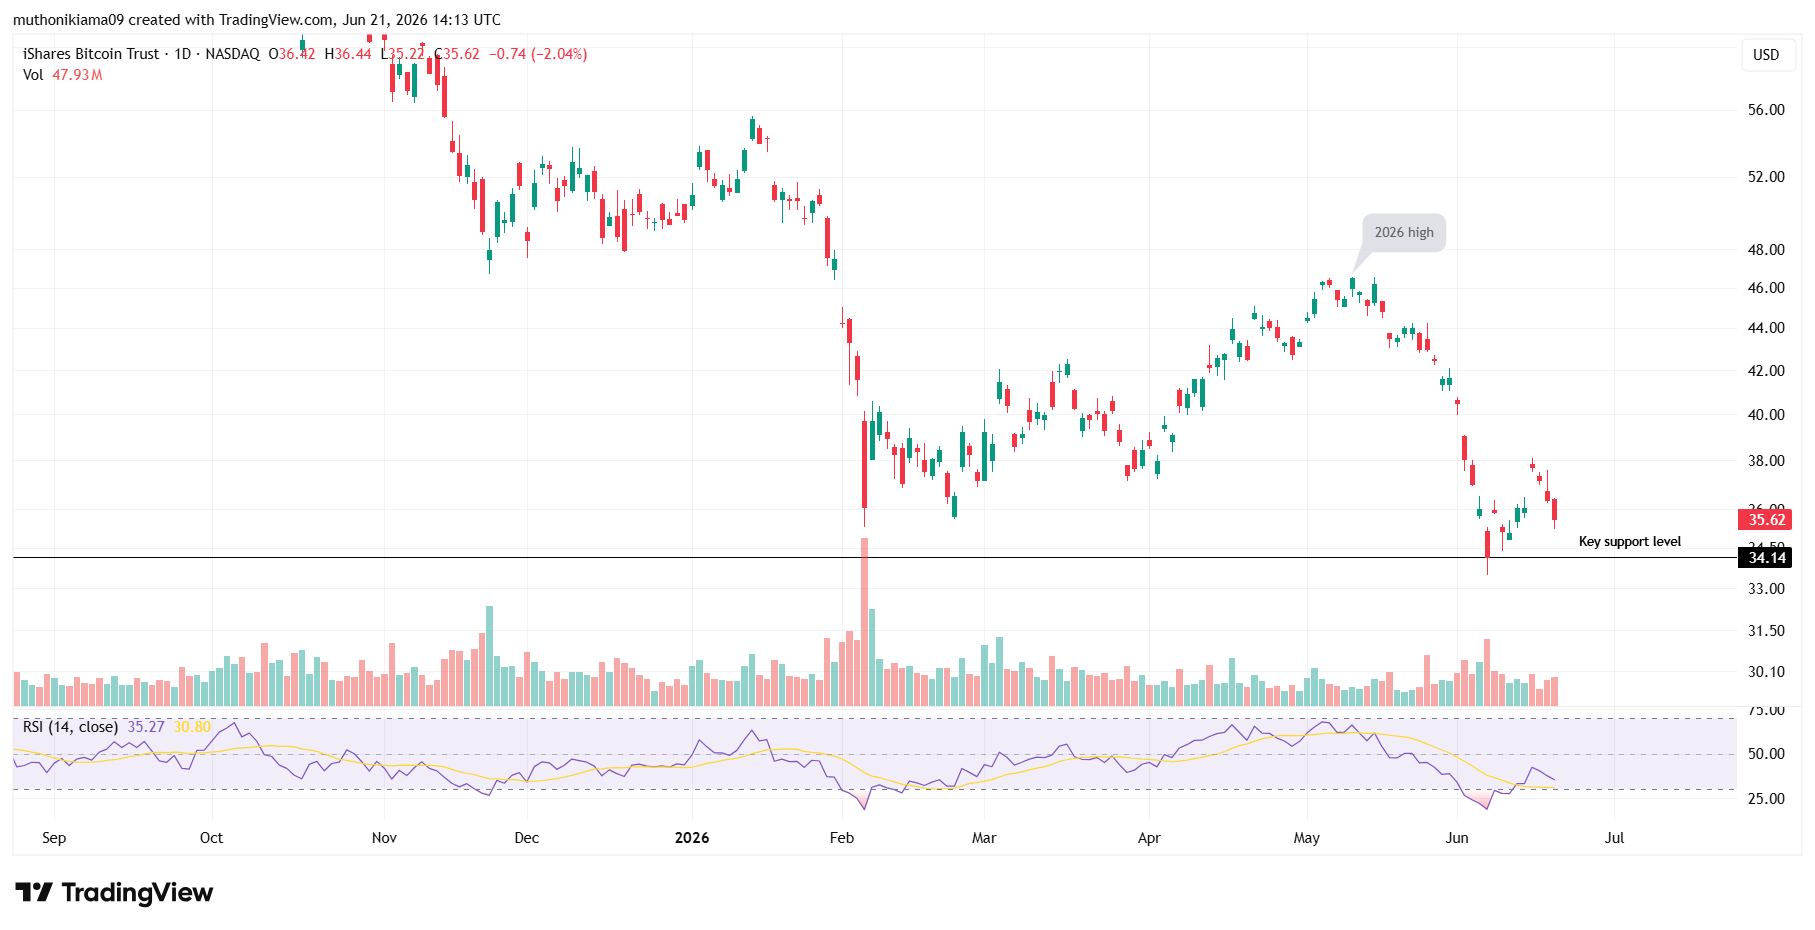
The volume bars that have been red for four straight days confirm that sell-side pressure has indeed been behind IBIT’s drop in market price, and if this continues, the Bitcoin ETF might retest this support of $34.


Fidelity’s FBTC Bitcoin ETF Overview
Fidelity’s FBTC is the second-biggest Bitcoin ETF with net assets of $11.30 billion and a cumulative net inflow of $10.46 billion per SoSoValue data.
FBTC holds 0.89% of Bitcoin’s market cap, and while it trails behind IBIT’s 3.79% share, Fidelity charges the same 0.25% fee on the ETF.
FBTC is listed on the CBOE Exchange, and it closed trading on June 18 at a price of $54 and that is a 50.9% drop from the 52-week high of $110.
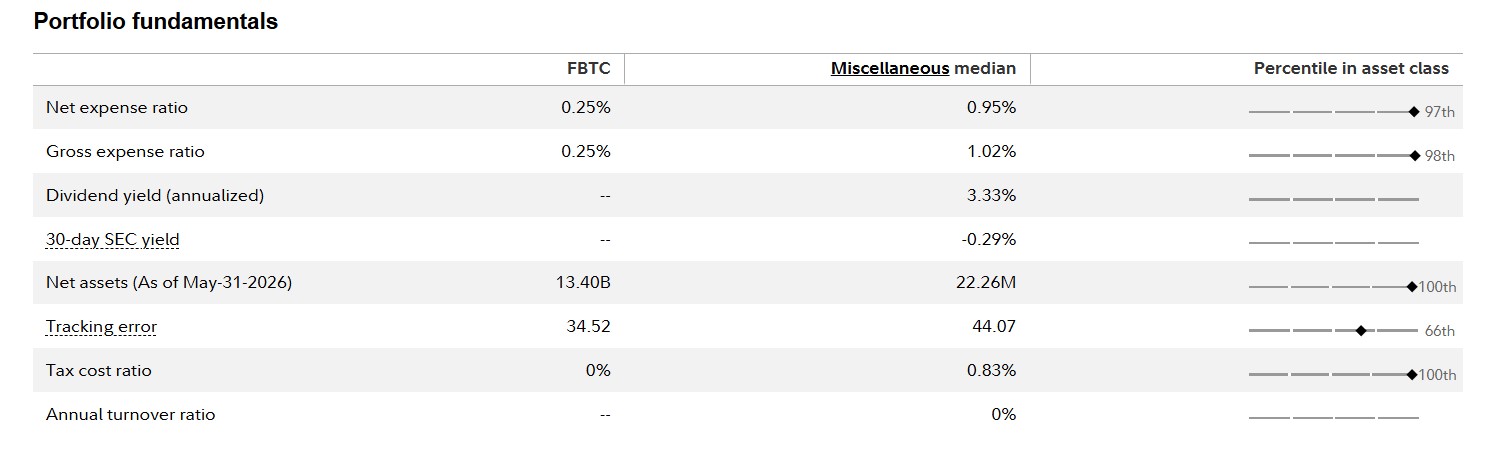
Fidelity says that FBTC offers 0.00087048 BTC per share, and that means that at the current price of Bitcoin of $64,000, an investor with 1 FBTC share holds $55 worth of Bitcoin.
Just like with IBIT, an investor who has held FBTC since it started trading in January 2024 has a return of 21%. However, FBTC’s loss of 30% in the last year is higher than IBIT’s loss of 18%.
FBTC’s Technical Analysis
The daily chart for FBTC shows the ETF has dropped from $71 on May 11 to $35 at press time, and this mirrors Bitcoin’s drop from $82,000 on May 11 to $64,000 at press time.
The RSI of 35 shows that the momentum around FBTC is currently favoring bears, but the AO bars that are green but on the negative side show that these bears could be losing their grip.
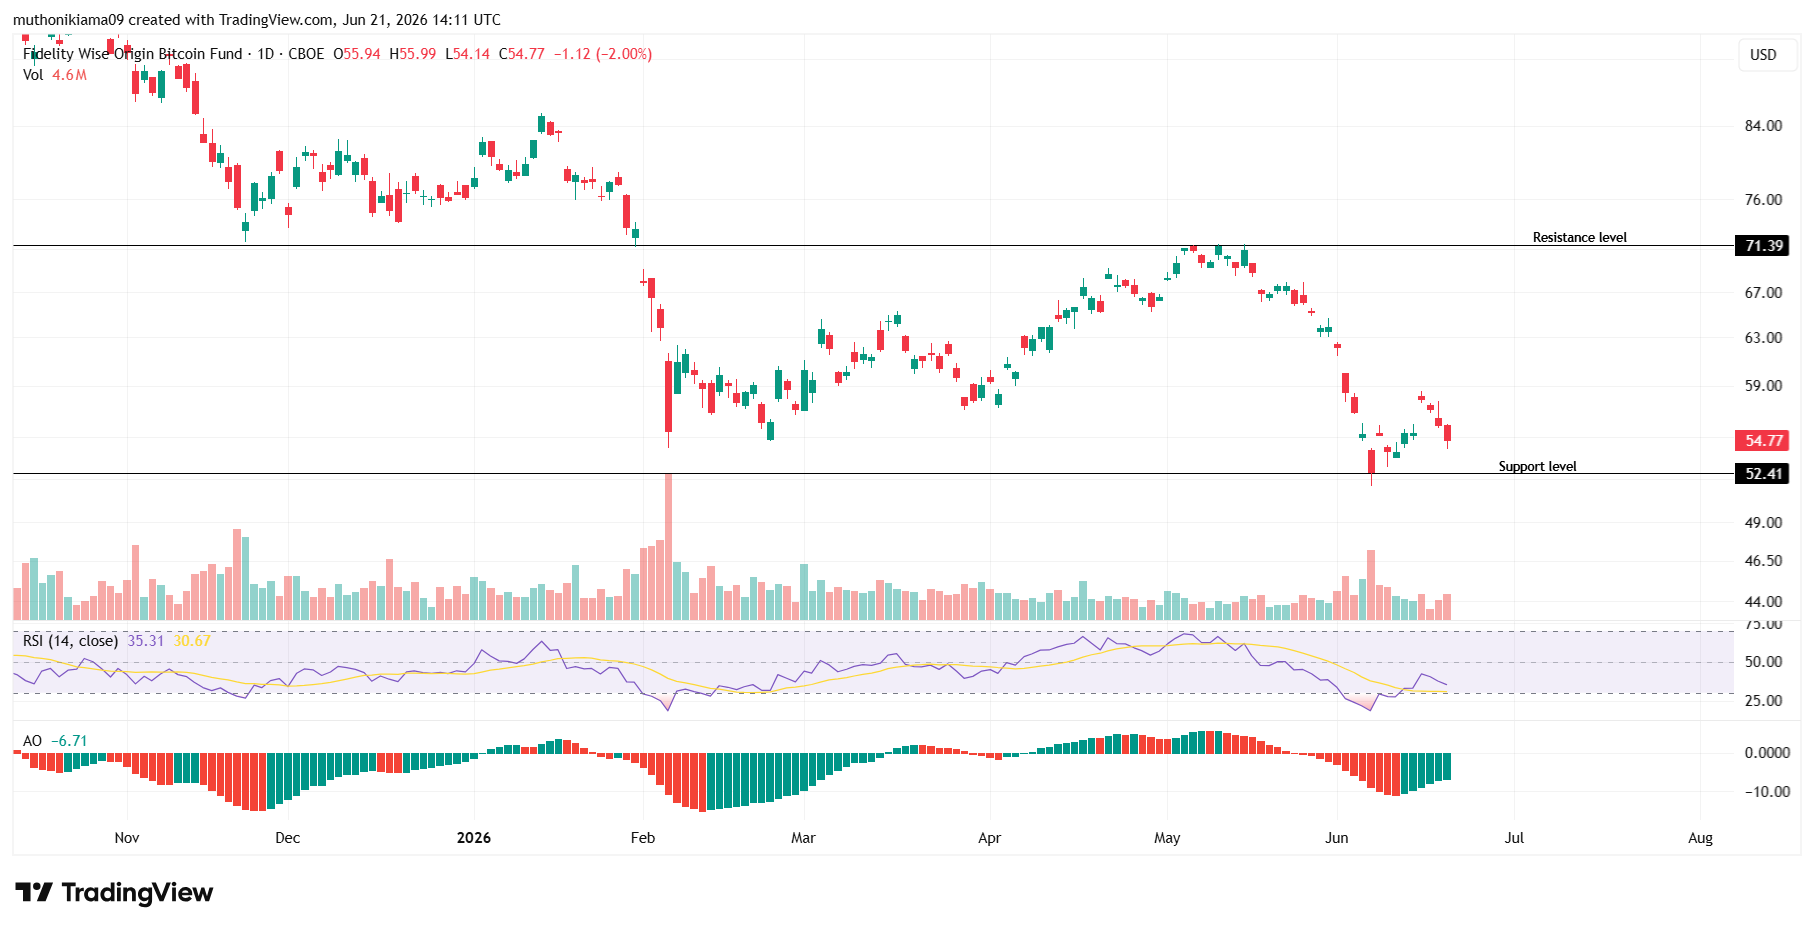
FBTC has established a support level of $52, but a move upward will only occur if bulls can push past the obstacle of $71.
Bitcoin Performance Relative to Bitcoin ETFs
Spot Bitcoin ETFs have largely influenced Bitcoin price for the last 30 months, and the two biggest ones: IBIT and FBTC, have either sparked gains or drops.
IBIT flows have turned negative in the six months leading to June 2026, with outflows totalling $26 million per SoSoValue data. FBTC has seen the same performance, with $1.6 million in outflows within the same period.
The Bitcoin price chart shows that these outflows have pushed the price lower, with BTC moving from $87,000 in January 2026 to $64,000 in June 2026.
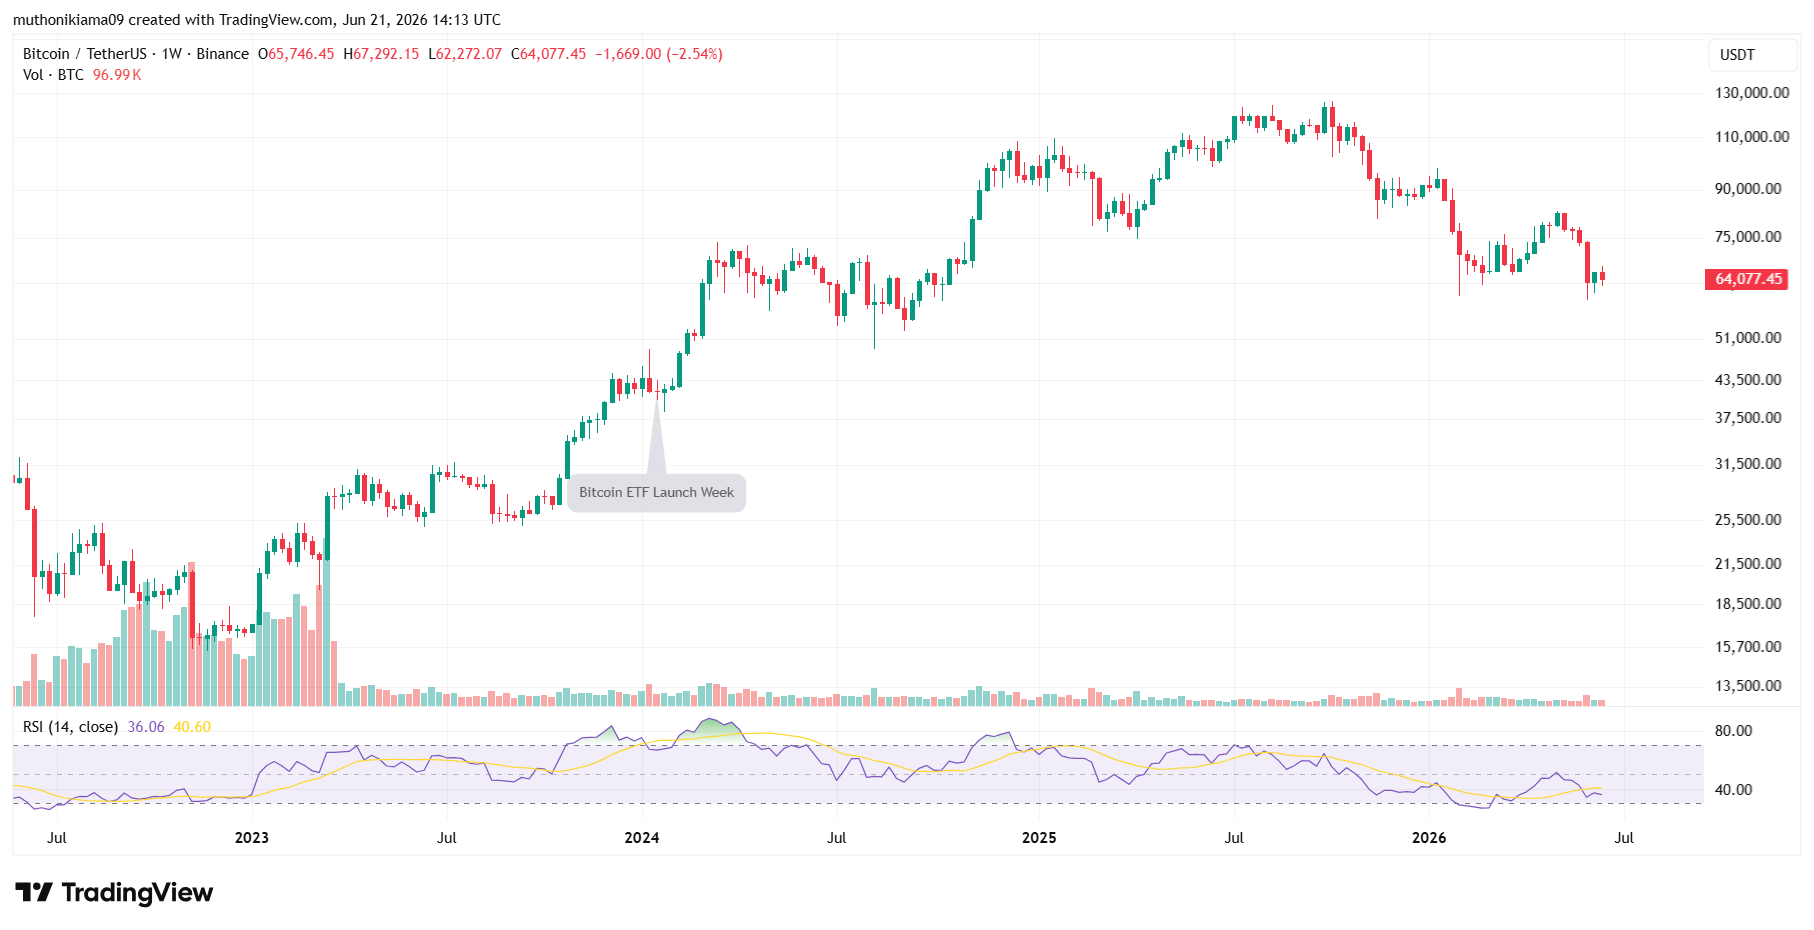
Zooming out on BTC’s chart to 2024, when the IBIT and FBTC ETFs started to trade, shows that the price of Bitcoin moved from $40,000 in January 2024 to $73,000 in March 2024, marking a 45% increase within three months.
That 2024 performance shows that the demand coming from institutions has assisted BTC’s price gains.
The RSI reading of 36 on Bitcoin’s weekly chart also suggests that the momentum is bearish as buy-side pressure fades, and this could be because fewer institutional investors are buying Bitcoin ETFs.
Which Bitcoin ETF Will Outperform?
Both IBIT and FBTC track the price of Bitcoin, and that means that they give the same return depending on whether BTC is rising or dropping.
However, IBIT has the upper hand, and it is already outperforming FBTC in net assets and cumulative inflows. Its 61% market share will likely keep climbing because Fidelity does not have any advantage over BlackRock because the two ETFs charge the same fees.
Therefore, IBIT will likely outperform FBTC in net assets and inflows in 2026 as its market share dominance pulls in new investors.
Instant Currency Exchange at BestChange with Ease
- Compare Rates Across 1000+ Exchanges
- Access 250+ Cryptocurrencies & Pairs
- Save Time with Real-Time Price Tracking
- Trusted & Verified Exchange Listings

Frequently Asked Questions (FAQs)
1. Can FBTC ETF outperform IBIT?
2. Will inflows to Bitcoin ETFs return?
3. How much BTC do Bitcoin ETFs hold?
Why Trust CoinGape
CoinGape has covered the cryptocurrency industry since 2017, aiming to provide informative insights Read more…to our readers. Our journal analysts bring years of experience in market analysis and blockchain technology to ensure factual accuracy and balanced reporting. By following our Editorial Policy, our writers verify every source, fact-check each story, rely on reputable sources, and attribute quotes and media correctly. We also follow a rigorous Review Methodology when evaluating exchanges and tools. From emerging blockchain projects and coin launches to industry events and technical developments, we cover all facets of the digital asset space with unwavering commitment to timely, relevant information.

24 Hours volume
$22.45B
Market Cap
$1.62T
Max Supply
21M



Delivered every day.
- Insights that move markets
- 100,000 active subscribers

CRYPTO IMPACT AWARDS 2026