Bitcoin Price Prediction as FSB Chief Fuels AI Bubble Fears After $650B Tech Selloff



Highlights
- Bitcoin price is in focus after gaining by 10% in July despite AI bubble fears.
- FSB Chief John Schindler warns that the AI bubble could trigger another financial crisis.
- BTC price trades a rising triangle pattern as bulls target $72,000.
Bitcoin (BTC) price is up by 1.41% today, July 29, to trade at $64,370 at the time of writing. The gains come despite growing concerns that the AI sector is in a bubble, with the secretary general of the Financial Stability Board, John Schindler, saying that the sector could trigger another financial crisis.
Schindler’s warning comes as US tech stocks shed $658 billion in July 2026, per a report by brokerage platform IG Markets.


AI Bubble Concerns Rise Amid Tech Rout
While speaking in an interview with Politico, Schindler noted that the gains seen in the AI sector are similar to the ones seen in the dotcom period. He noted that these new sectors tend to gain as investors chase “the latest darling of the market.”
“We saw this in the housing price bubble before the great financial crisis. We might be seeing that now,” Schindler said.
His outlook follows a notable decline in the prices of AI stocks even as Bitcoin rises. NVDA stock price has dropped from $235 in May to $197 by market close on July 28, while Micron stock is also down by 28% in one month.
SPCX stock price is also down by 50% since its June 12 IPO.
IG Markets notes that these drops have seen mega-cap stocks in the US lose more than $658 billion of their value in July 2026 alone. The Nasdaq-100 index dropped to its lowest point since May 2026 because of this decline.
But while these stocks edged lower, Bitcoin price has gained from $57,800 on July 1 to $64,000. These gains suggest that investors could be rotating from AI stocks even as BTC miners shift from mining to AI infrastructure.


Bitcoin Price Outlook as Triangle Pattern Emerges
Bitcoin price is trading within a rising triangle pattern on the four-hour chart. This pattern usually suggests that the upward trend could continue if the price continues to make higher lows.
BTC has bounced from the support at the lower boundary of this pattern at $63,000. But it needs to close above the resistance of $64,600 to confirm that the ascending triangle pattern is in play.
This triangle pattern has a height of 12%, and this is how high the price of Bitcoin can rise if it closes above the resistance of $64,600. This rise could push BTC price to $72,352.
However, if buyers become hesitant again and Bitcoin price moves below the support at the lower boundary of this triangle pattern, BTC price could retest the support of $60,000.
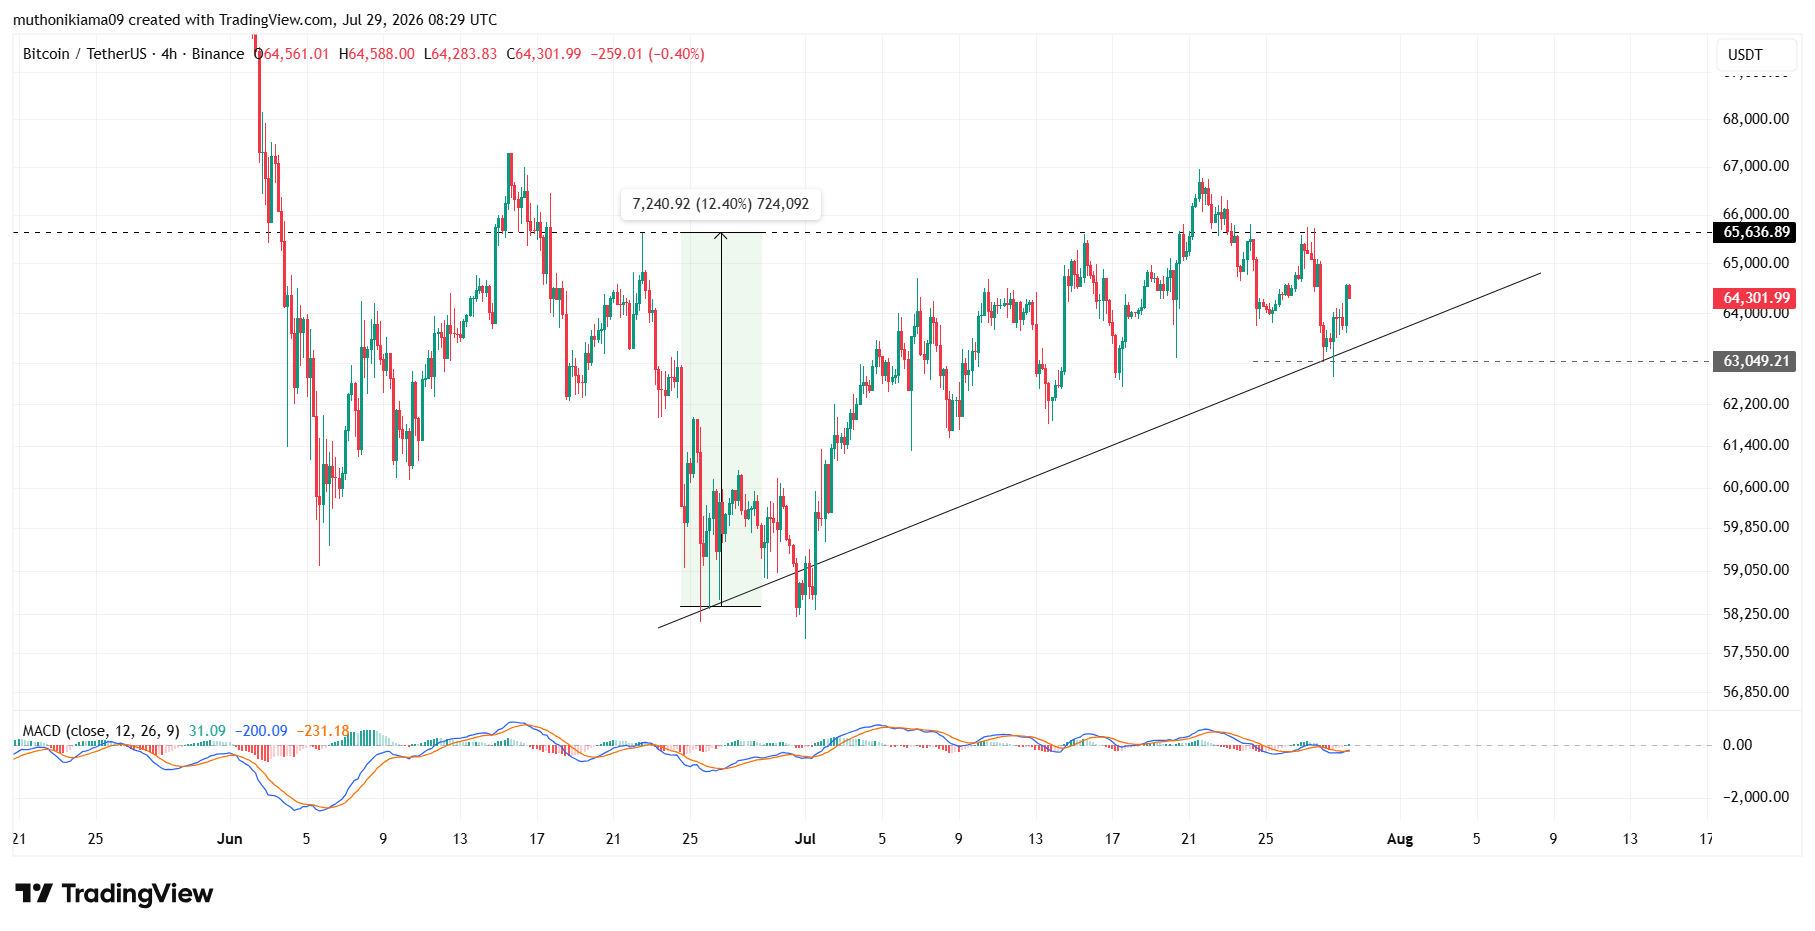
The MACD line that is negative also supports a bearish long-term Bitcoin price prediction. However, the crossover of the MACD line above the signal line suggests that bears are losing their grip.
Bitcoin Long Positions Rise Despite ETF Outflows
Data from Coinglass shows that Bitcoin’s weighted funding rate has reached 0.0087%. This funding rate is now at the highest point since June 14, suggesting that long buyers are increasing their positions.
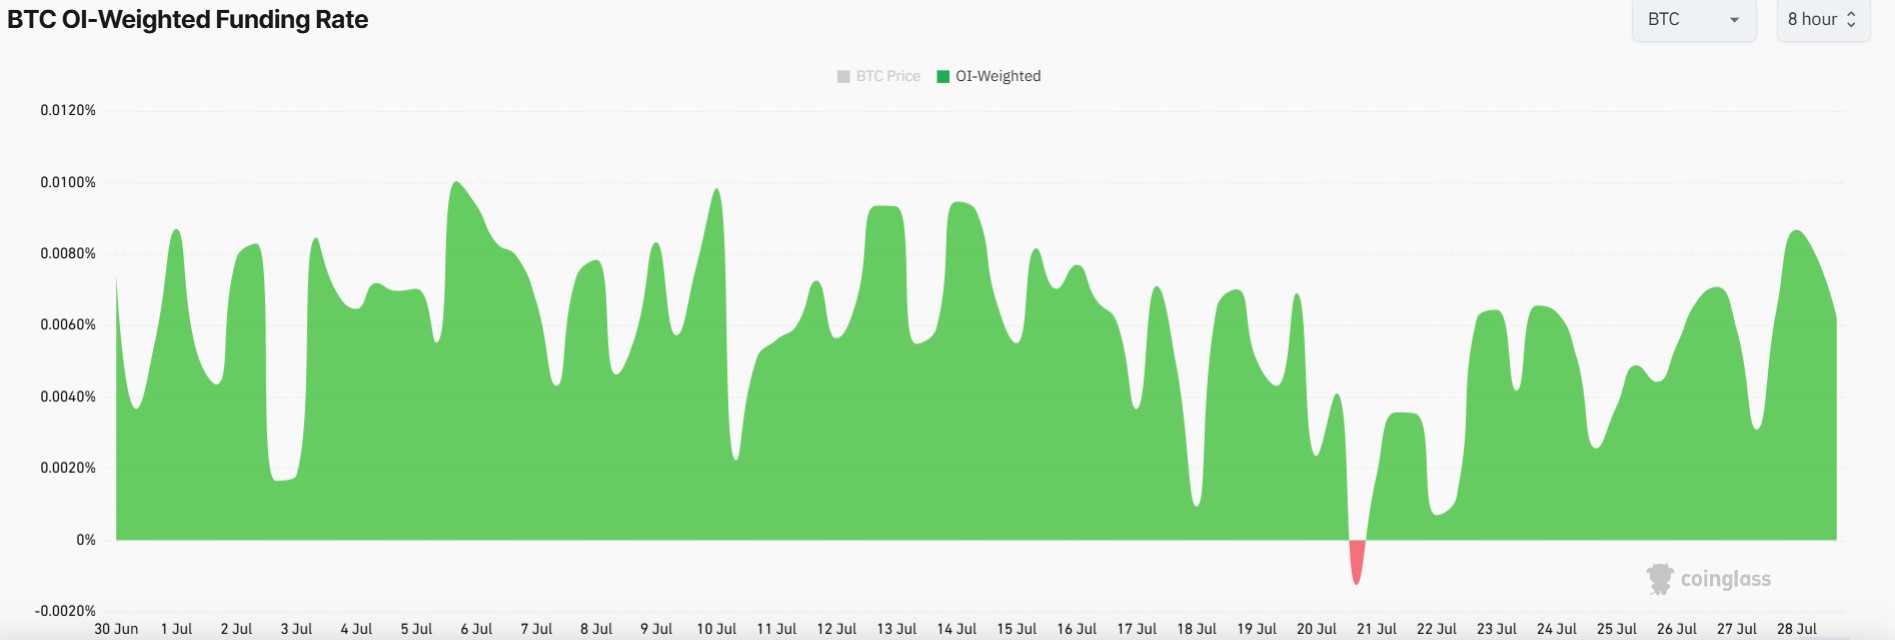
But this long positioning comes on the backdrop of weak demand for Bitcoin by institutions. Data from SoSoValue shows that BTC ETFs have posted four straight days of outflows.
These ETFs have shed $526 million in four trading days alone, suggesting that institutions are exiting Bitcoin as the price stalls between $64,000 and $65,000.
Instant Currency Exchange at BestChange with Ease
- Compare Rates Across 1000+ Exchanges
- Access 250+ Cryptocurrencies & Pairs
- Save Time with Real-Time Price Tracking
- Trusted & Verified Exchange Listings

Frequently Asked Questions (FAQs)
1. Why is Bitcoin price up today?
2. How will the AI bubble affect Bitcoin price?
3. How high could BTC price go in August 2026?
Why Trust CoinGape
CoinGape has covered the cryptocurrency industry since 2017, aiming to provide informative insights Read more…to our readers. Our journal analysts bring years of experience in market analysis and blockchain technology to ensure factual accuracy and balanced reporting. By following our Editorial Policy, our writers verify every source, fact-check each story, rely on reputable sources, and attribute quotes and media correctly. We also follow a rigorous Review Methodology when evaluating exchanges and tools. From emerging blockchain projects and coin launches to industry events and technical developments, we cover all facets of the digital asset space with unwavering commitment to timely, relevant information.

24 Hours volume
$12.97B
Market Cap
$1.62T
Max Supply
21M



Delivered every day.
- Insights that move markets
- 100,000 active subscribers

CRYPTO IMPACT AWARDS 2026