Crypto Market Update August 10: BTC, ETH Stall as Solana Hits 2-Week High Ahead of US Inflation Data



Highlights
- The crypto market is moving sideways today as most coins fail to make meaningful gains.
- Solana price stands out after surging to its highest price in two weeks of $77.
- Whales are accumulating Bitcoin ahead of the release of US inflation data later this week.
The crypto market is range-bound today, August 10, as Bitcoin (BTC) stalls between $64,700 and $65,300 while Ethereum (ETH) defends support at $1,900. However, Solana (SOL) has outperformed the two biggest cryptos and reached its highest price since July 27 of $77 ahead of the release of US inflation data that comes out on August 12.


Key Factors Driving the Crypto Market Today
The lack of meaningful gains across the crypto market today comes as investors await the release of the US CPI print on August 12. MarketWatch shows that analysts expect inflation to drop from 3.5% in June 2026 to 3.4% in July 2026.
Crypto market traders are also waiting to see whether this inflation report will have an impact on whether the Fed will raise or trim interest rates at the September FOMC meeting, with all the top ten cryptos registering minimal gains or losses of less than 1%.
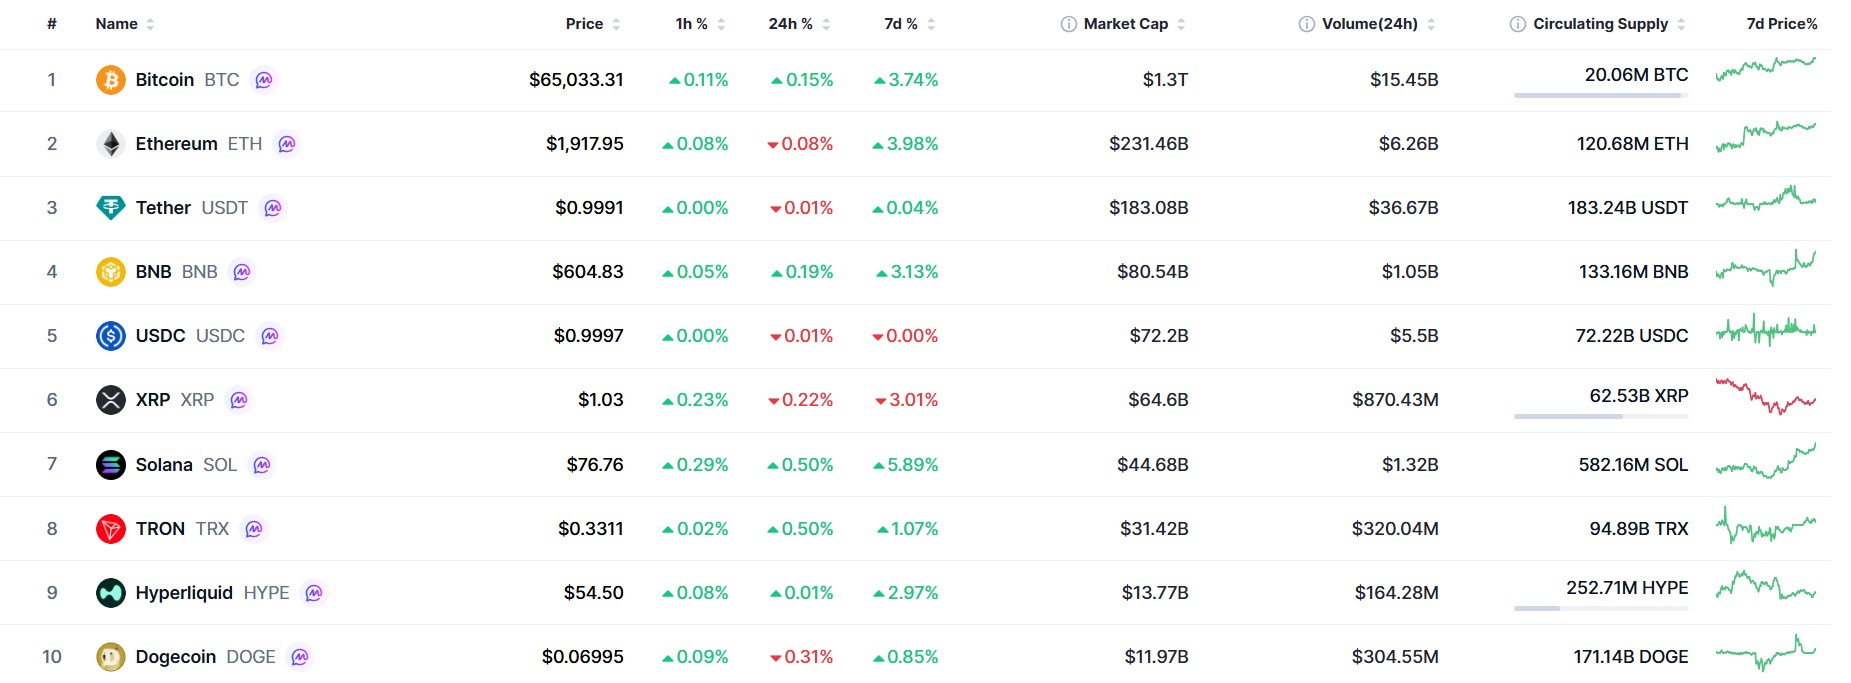
Fed interest rate prediction markets show that only 36% of investors expect the Fed to hike rates. If the odds of a Fed rate hike fall after the CPI data comes out, it could bode well for crypto market prices.
Easing geopolitical tensions are also moving crypto prices today and are helping Bitcoin and Ethereum to defend the support at $64,500 and $1,900, respectively.
A previous report by CoinGape revealed that the US and Iran are making progress in negotiation talks to end the conflict, with a peaceful resolution set to boost demand for crypto coins.
The crypto market is also making slight gains because of rising institutional demand that is being seen in the rising inflows to crypto exchange-traded funds (ETFs).
A recent report by CoinGape revealed that weekly inflows to Ethereum ETFs reached $244 million in the week between August 3 and August 7, with this being the highest inflows seen since April 2026. Bitcoin ETFs also posted $844 million in inflows during the week.


Crypto Market Data Today
- Total Crypto Market Cap: $2.22 trillion (+0.10%)
- 24-Hour Trading Volumes: $42.96 billion
- Bitcoin: $65,064 (+0.23%)
- Ethereum: $1,918 (+0.06%)
- XRP: $1.03 (-0.28%)
- Bitcoin Dominance: 58.9%
- Ethereum Dominance: 10.4%
- Altcoin Season Index: 39/100
- Fear and Greed Index: 30 (Fear)
Derivatives Market Analysis
The total liquidations across the crypto market have reached $93 million today, August 10, with this being a 37% drop from the liquidations seen on August 9.
Bitcoin and Ethereum have the biggest liquidations of $17 million and $14 million, respectively, while the biggest liquidation order occurred on Binance, involving a BTC/USD position worth $1.07 million.
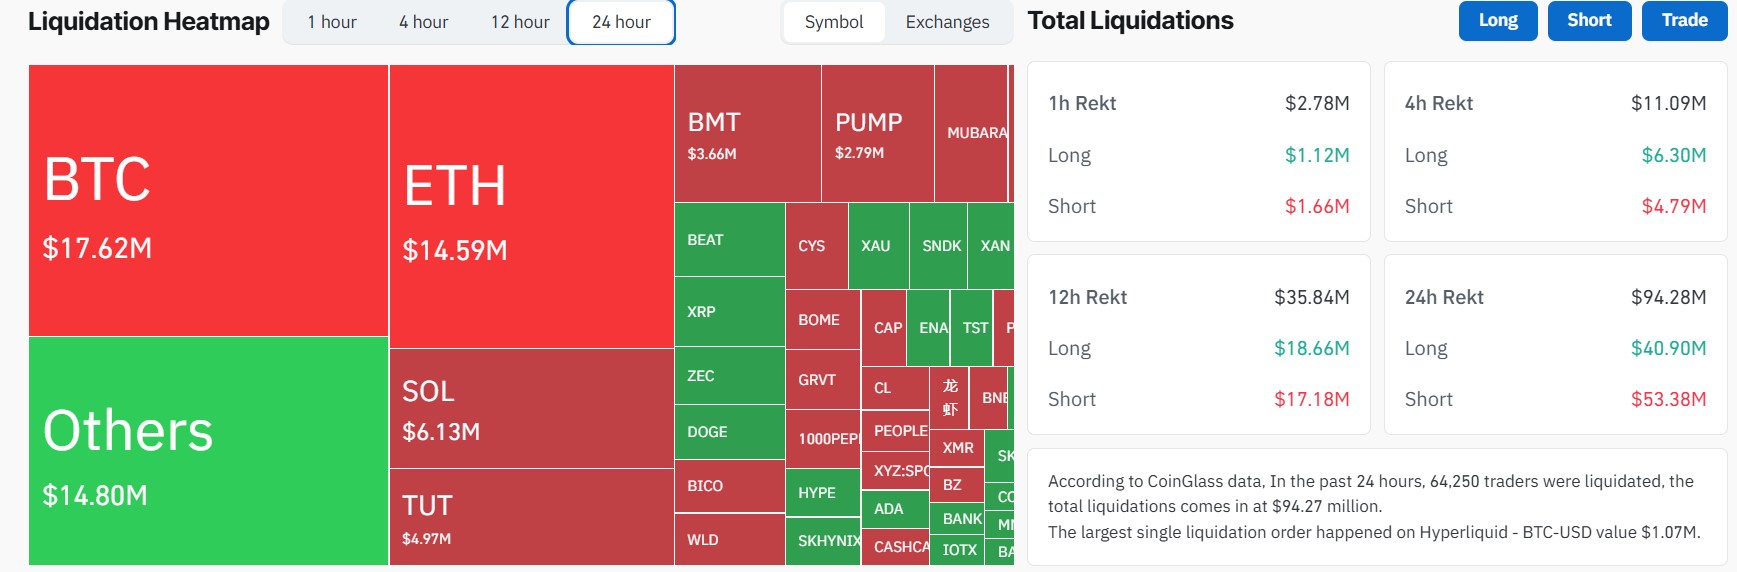
The total open interest across the crypto market is also up by $1.05% to $114 billion at the time of writing, while the total derivatives trading volumes stand at $76 billion.
The rising OI likely comes from long positions, with CoinGlass data showing that the Bitcoin OI-weighted funding rate sits at 0.0077% while Ethereum’s OI-weighted funding rate stands at 0.0057%.
Whales Accumulate BTC Ahead of Inflation Data
Data from CryptoQuant shows that addresses holding more than 10,000 BTC purchased 46,420 coins on August 9. Analyst Amr Taha notes that this marks the most coins purchased by whales in a single day since March 15.
At the same time, small traders who hold between 0.1 and 1 BTC sold 9,700 coins on August 9, suggesting that they are not convinced of a bullish long-term Bitcoin price outlook.
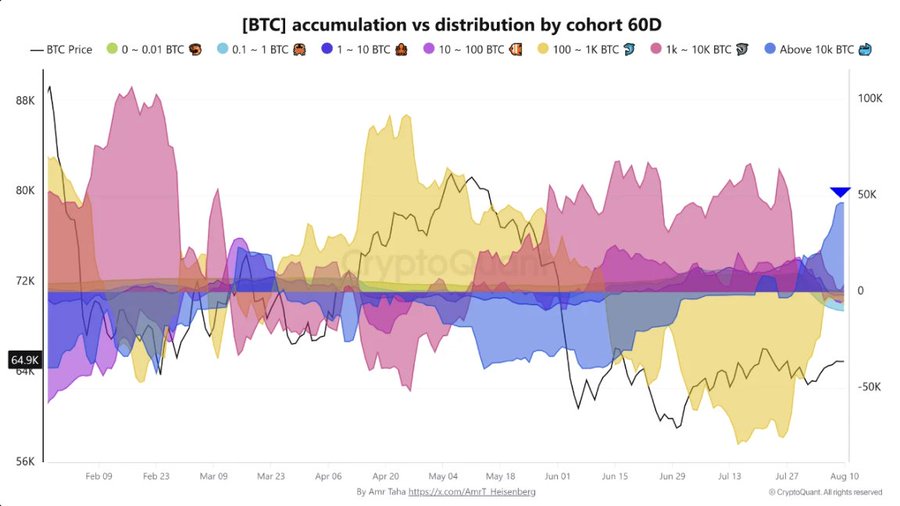
The purchases by whales come as Bitcoin’s active addresses drop to 2018 lows, with analysts noting that the drop usually suggests that the price of Bitcoin has bottomed out.
Ethereum Price Creates Ascending Triangle Pattern
The price of Ethereum is creating a rising triangle pattern despite the crypto market stalling today. ETH needs to close above the resistance at $1,925 at the top of this pattern to confirm that the gains that started on August 1 will continue.
The MACD line that is positive suggests that the momentum is favoring bulls, and this could help ETH to move above the resistance of $1,925. Still, the MACD histogram bars that are red and negative warn that buying pressure is weak near the resistance line.
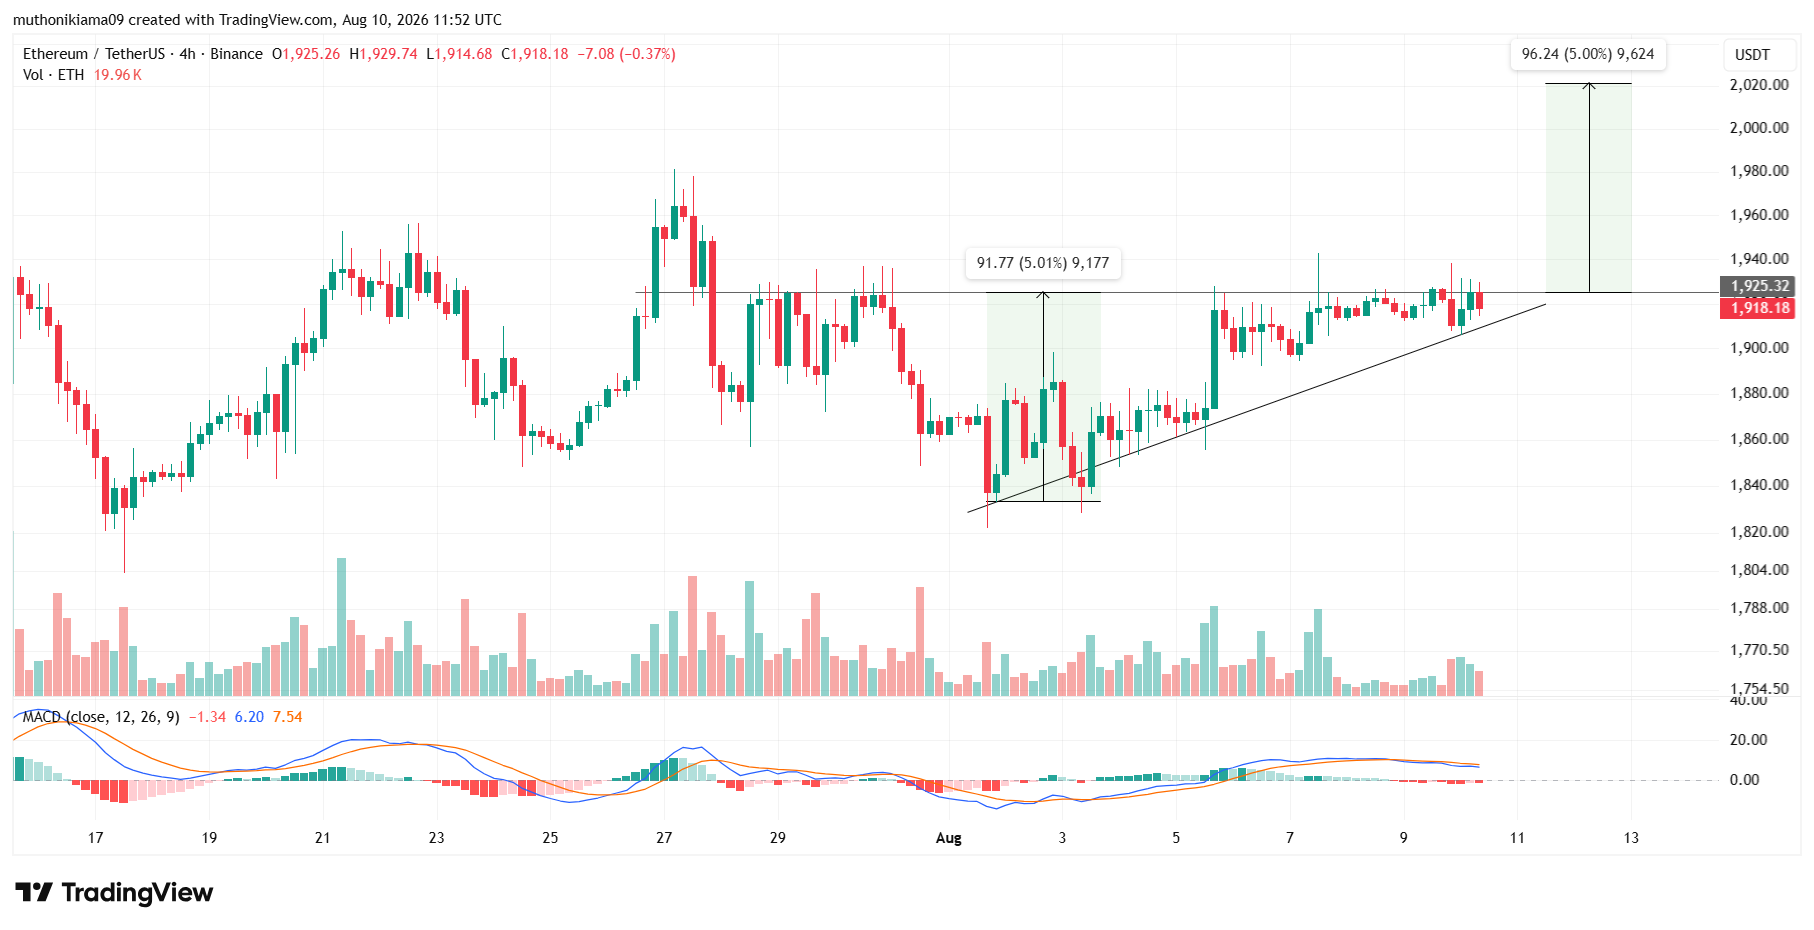
If Ethereum closes above $1,925 for three straight days, the price could move to the psychological resistance at $2,000.
Analyst Eyes $100 Solana Price Target After Rally to 2-Week High
Analyst Ali Charts on X notes that the price of Solana could move to the psychological resistance of $100. His bullish long-term Solana price outlook comes after SOL rose to $77 on August 10, with this being its highest price since July 27.
The analyst identified two bullish signs that SOL could reach $100: a golden cross with the MACD and the TD Sequential that has created a buy signal.
If Solana price closes above the resistance at $78, the analyst says that the price could leap to $100.
Catch up on yesterday’s biggest moves in our Crypto Market Update August 9.
Instant Currency Exchange at BestChange with Ease
- Compare Rates Across 1000+ Exchanges
- Access 250+ Cryptocurrencies & Pairs
- Save Time with Real-Time Price Tracking
- Trusted & Verified Exchange Listings

Frequently Asked Questions (FAQs)
1. What is driving the crypto market today?
2. How high could Solana price go?
3. How high could Bitcoin and Ethereum prices go today?
Why Trust CoinGape
CoinGape has covered the cryptocurrency industry since 2017, aiming to provide informative insights Read more…to our readers. Our journal analysts bring years of experience in market analysis and blockchain technology to ensure factual accuracy and balanced reporting. By following our Editorial Policy, our writers verify every source, fact-check each story, rely on reputable sources, and attribute quotes and media correctly. We also follow a rigorous Review Methodology when evaluating exchanges and tools. From emerging blockchain projects and coin launches to industry events and technical developments, we cover all facets of the digital asset space with unwavering commitment to timely, relevant information.

24 Hours volume
$31.15B
Market Cap
$1.65T
Max Supply
21M



Delivered every day.
- Insights that move markets
- 100,000 active subscribers

Global ONCHAIN AWARDS 2026