Dogecoin Price Prediction as Binance Records $1.2B Memecoin Sell-Off



Highlights
- Dogecoin price is up today as US CPI data fuels a crypto market recovery.
- Despite these gains, Dogecoin remains under bearish pressure amid intense sell-side pressure.
- CryptoQuant data shows that Binance has recorded a $1.2B meme coin selloff as investors minimize risks.
Dogecoin (DOGE) price is up by 2.25% today, July 14, to trade at $0.073 at the time of writing. The gains come as the broader crypto market recovers after the US inflation dropped to 3.5%. Still, Dogecoin remains below all EMAs amid an ongoing meme coin selloff that has wiped out $1.2 billion from Binance.


Binance Faces $1.2B Meme Coin Selling Pressure
Data from CryptoQuant shows that traders on Binance have sold $1.2 billion worth of meme coins since October 2025. Analyst Darkfost notes that traders are selling because meme coins are the “riskiest assets” in crypto.
This selling pressure has pushed the price of Dogecoin down from $0.26 in October 2025 to $0.07 today, July 14. This means Dogecoin is down by 73% in eight months. In contrast, Bitcoin has dropped by 50% within the same period.
Still, the launch of Robinhood Chain has revived interest around meme coins, with Robinhood Chain tokens like CASHCAT reaching a market cap of $138 million since the chain launched on July 1.
Dogecoin is also gaining today, July 14 after US inflation dropped to 3.5%, reviving bullish momentum around risk assets because the Fed has less incentive to hike interest rates. But analyst Dark Frost warns these gains may not be sustainable.
Darkfost maintains that the long-term Dogecoin price forecast remains bearish unless there is sustained buying pressure.


Dogecoin Price Remains Below Key EMA Levels as Bearish Pressure Surges
The price of Dogecoin has dropped below the 200-day EMA, 100-day EMA, and 50-day EMA levels. This drop suggests that the momentum is favoring bears.
Dogecoin price now trades at the support of $0.071. Closing below this support could see the price drop to the June 30 low of $0.069.
The RSI reading of 41 suggests that the momentum is still favoring bears, and this supports the bearish thesis of a drop to $0.069.
But the RSI line is rising, and if it makes a higher high above $50, it could invalidate the bearish thesis, and Dogecoin could move to the 50-day EMA of $0.082.
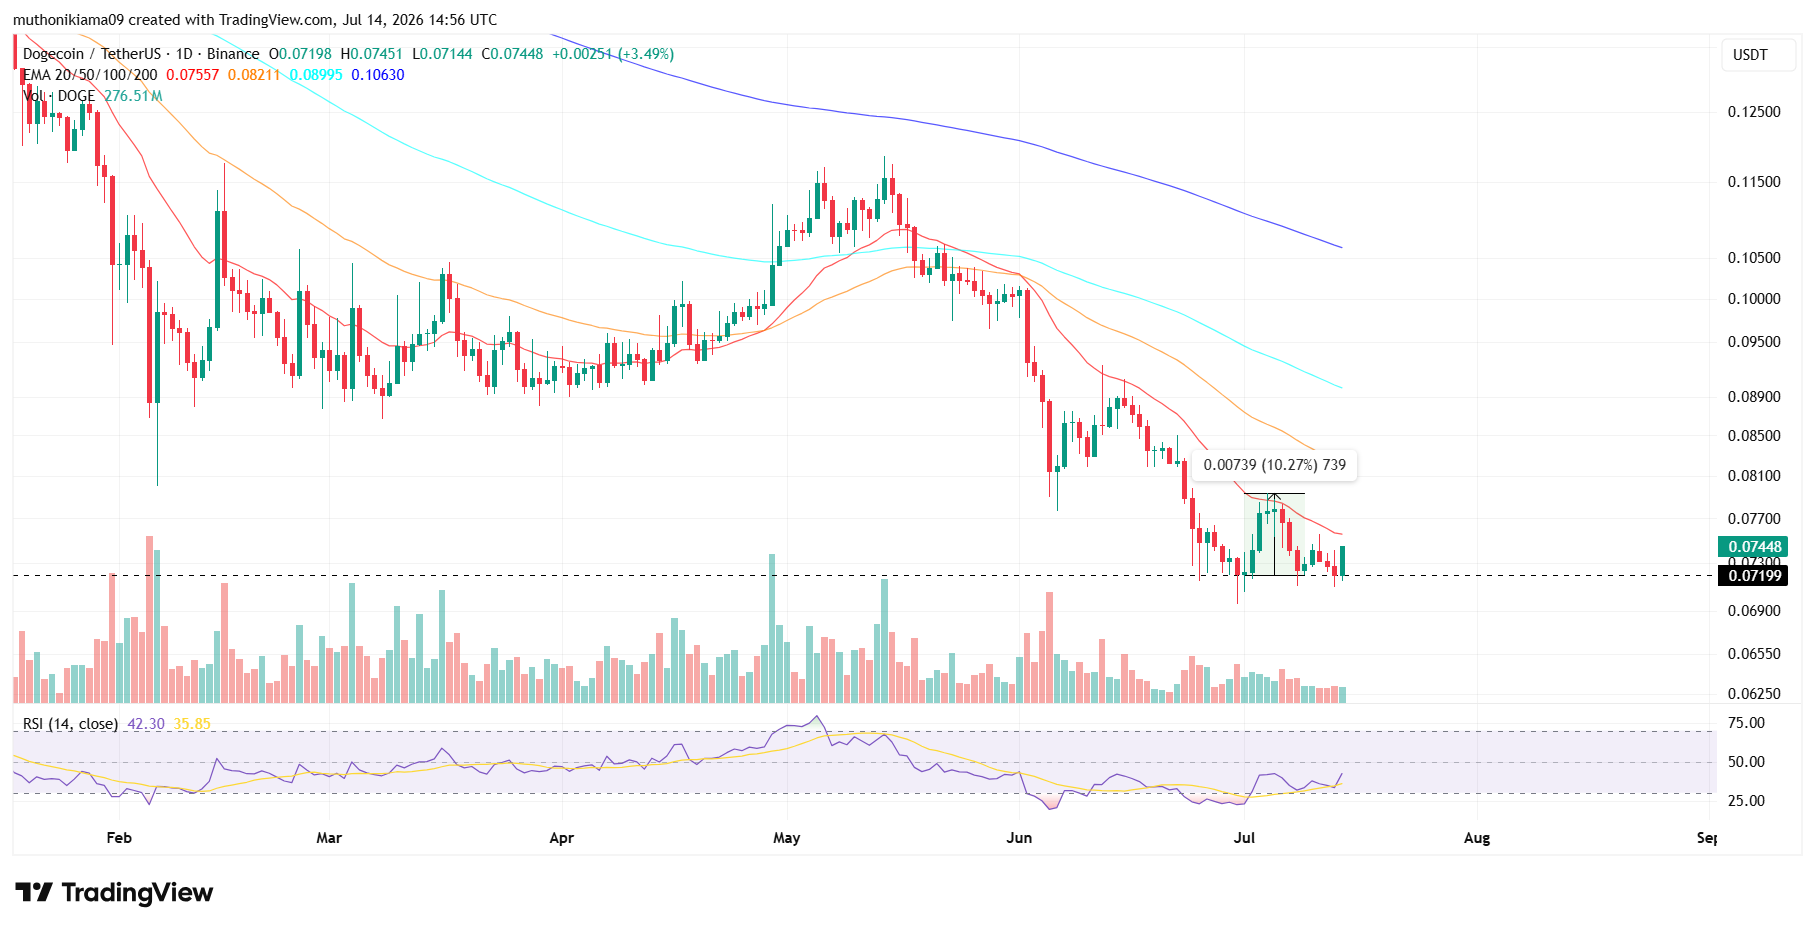
Zooming in on the daily chart shows that Dogecoin could be forming a bullish W pattern if it bounces from the support of $0.071.
If the pattern plays out, Dogecoin faces the first obstacle at the July 4 high of $0.079 before a 10% rally ensues to $0.0869.
Dogecoin ETFs Post Zero Inflows For Four Weeks
Data from SoSoValue shows that Dogecoin ETFs have not seen any inflows since June 17 despite Trump’s recent push for crypto. In fact, the ETFs have seen zero flows for six straight days since July 2.
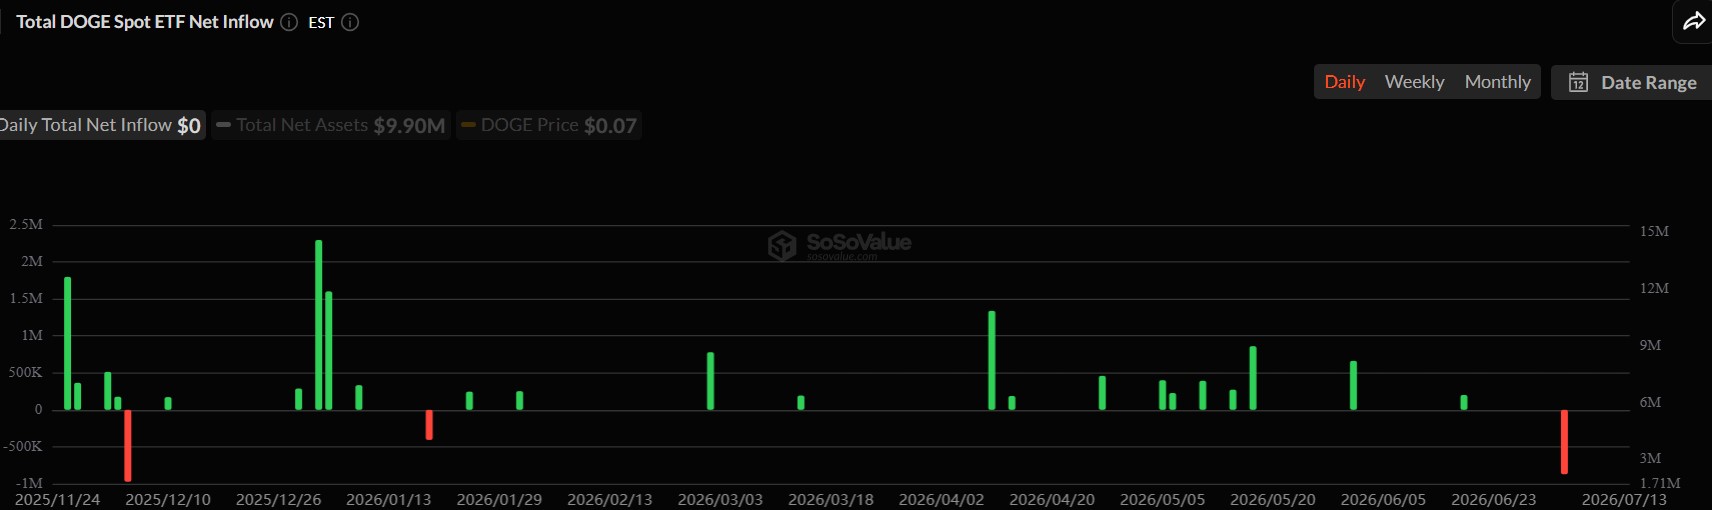
These fading inflows suggest that institutional demand towards Dogecoin ETFs has dropped and this is also pulling the price down.
Dogecoin ETFs now have $9.9 million in net assets since they started trading in November 2025. These net assets are equal to only 0.09% of Dogecoin’s market cap.
Dogecoin’s Open Interest Falls as Long/Short Ratio Tumbles
Dogecoin’s open interest has dropped from $1.76 billion in May 2026 to $1 billion on July 14. The drop suggests that speculative interest towards Dogecoin has faded as the meme coin struggles under high selling pressure.
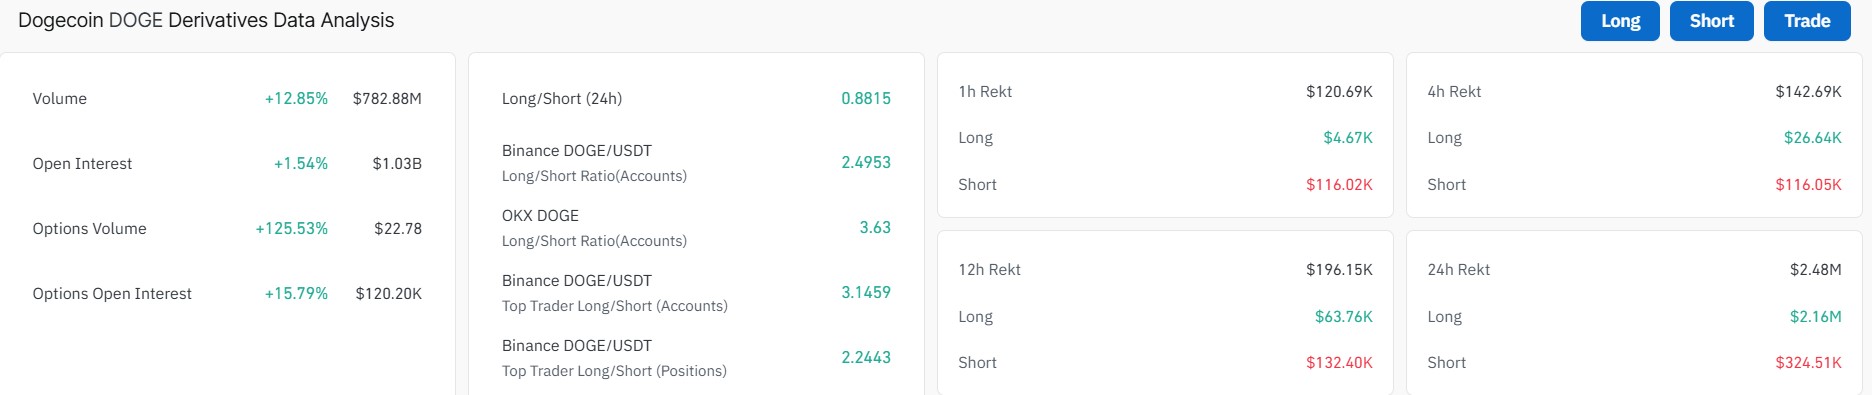
The long/short ratio for Dogecoin has also dropped to 0.88 per CoinGlass data. This drop suggests that many traders are betting that the price of DOGE will continue to drop.
Instant Currency Exchange at BestChange with Ease
- Compare Rates Across 1000+ Exchanges
- Access 250+ Cryptocurrencies & Pairs
- Save Time with Real-Time Price Tracking
- Trusted & Verified Exchange Listings

Frequently Asked Questions (FAQs)
1. Why is Dogecoin price up today?
2. Can Dogecoin price reach $0.10 despite the ongoing meme coin selloff?
3. What is the key support level for Dogecoin?
Why Trust CoinGape
CoinGape has covered the cryptocurrency industry since 2017, aiming to provide informative insights Read more…to our readers. Our journal analysts bring years of experience in market analysis and blockchain technology to ensure factual accuracy and balanced reporting. By following our Editorial Policy, our writers verify every source, fact-check each story, rely on reputable sources, and attribute quotes and media correctly. We also follow a rigorous Review Methodology when evaluating exchanges and tools. From emerging blockchain projects and coin launches to industry events and technical developments, we cover all facets of the digital asset space with unwavering commitment to timely, relevant information.

24 Hours volume
$998.16M
Market Cap
$14.52B
Max Supply
NA



Delivered every day.
- Insights that move markets
- 100,000 active subscribers