
Solana Price Forecast: Analyst Eyes $150 After 11 Weeks of ETF Inflows



Highlights
- Solana price remains above $120 as Ali Charts eyes $150.
- Spot Solana ETFs continued its inflow run to eleven weeks.
- The resistance at $125 is still critical and the MACD is a caution sign.
Solana price held above $120 as analyst Ali Charts eyed $150 after 11 straight weeks of US spot ETF inflows. The wider crypto market was up 1.11% to $2.9 trillion in 24 hours on institutional Bitcoin demand.
Bitcoin price traded near $84,000, while Ethereum stayed above $2,700. XRP hovered at $1.54, as traders watched for recovery.
Analyst Eyes $150 After 11 Weeks of ETF Inflows
Solana price is back in focus after an analyst set a $150 target, citing demand for U.S. spot funds. The analyst said ETFs acquired roughly 4.37 million SOL since July 13, worth about $450 million. He cited 11 consecutive weeks of net inflows as a sign of sustained interest.
SOLANA BREAKOUT INCOMING
US Spot Solana ETFs have accumulated roughly 4.37 million $SOL, worth around $450 million, since July 13.
That marks 11 consecutive weeks of net inflows.
With institutional demand continuing to absorb Solana, I’m watching for the next leg higher toward… https://t.co/MFkzEsSE1U pic.twitter.com/t326pdjRTh
— Ali Charts (@alicharts) September 29, 2026
That forecast remains conditional on demand continuing. ETF buying could tighten supply, but SOL also responds to broader market swings. A lasting move toward $150 would need more than one strong week.
SOL ETF Inflows Extend Their Streak
U.S. spot Solana ETFs drew $188.21 million in the week ending September 27, SolanaFloor data showed. SolanaFloor called it the strongest weekly reading in 10 months. Bitwise’s BSOL led with $128.46 million, followed by Grayscale’s GSOL at $28.06 million.
Fidelity’s FSOL also collected $17.59 million, adding to gains across the larger funds. Data from SoSoValue showed another $12.70 million in net inflows on September 28. Cumulative net inflows reached $1.62 billion, with total net assets at $1.93 billion.
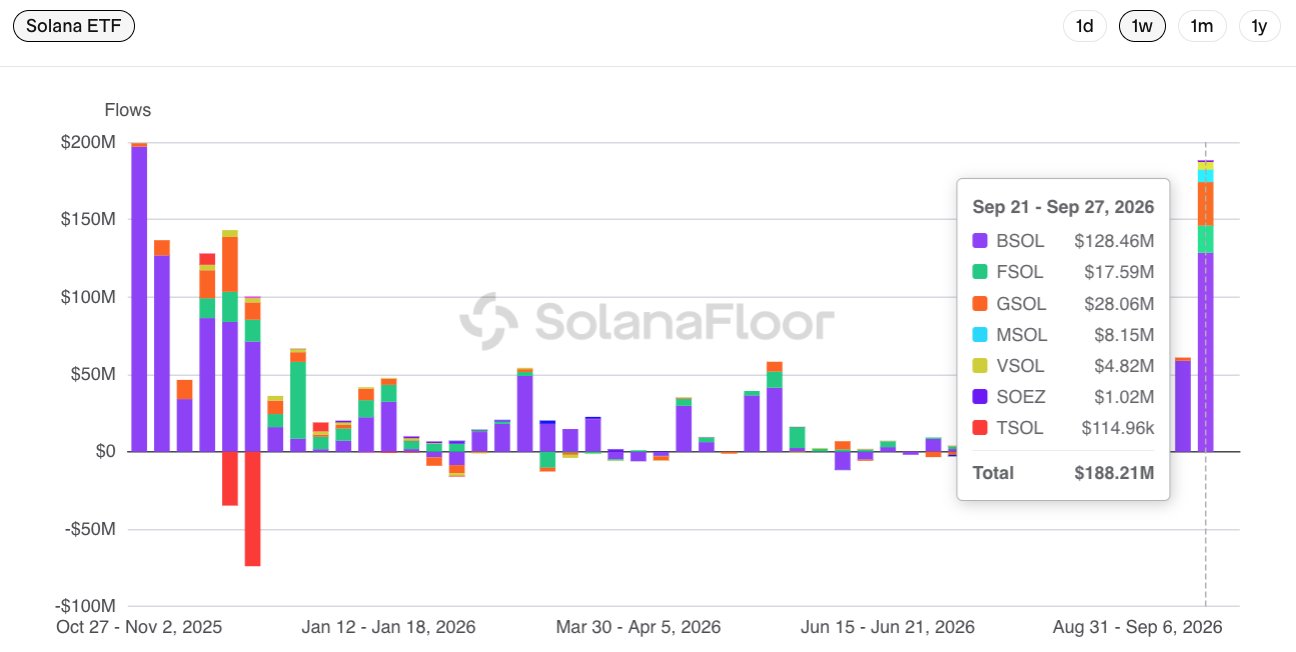
The assets represented 2.76% of Solana’s market capitalization. The 4.37 million SOL figure measures tokens amassed since July 13. The $1.62 billion measure covers net dollar flows over the funds’ entire history.
Solana Leads Tokenized Commodities Trading for the First Time
The Solana network led weekly spot trading in tokenized commodities for the first time, according to Blockworks data. From September 21 to 27, its decentralized exchanges processed $91.1 million, accounting for 28% of the combined $322.7 million market.
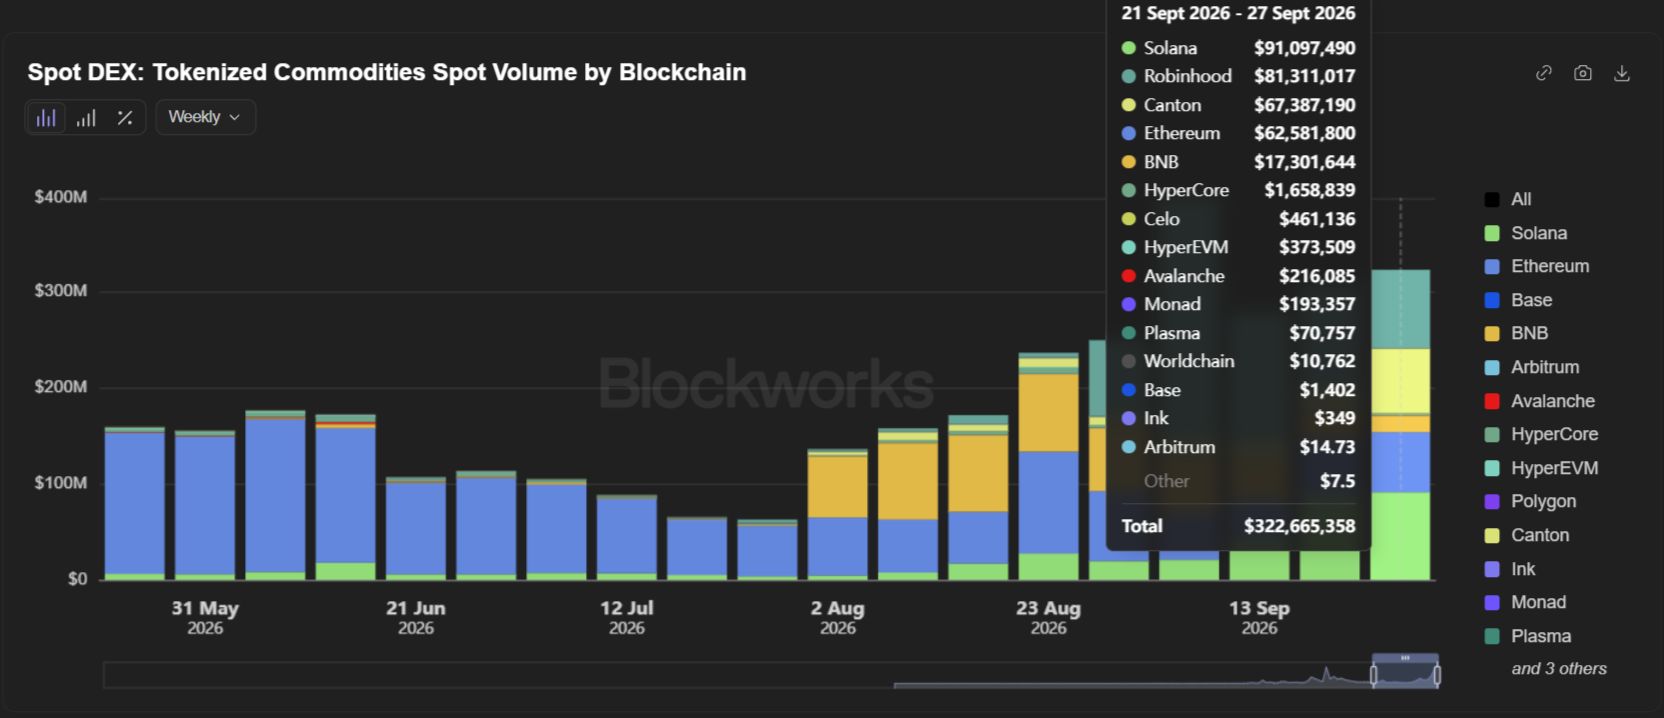
Robinhood Chain ranked second with $81.3 million, or roughly 25%. Solana’s share rose from 5% four weeks earlier. Canton followed with $67.4 million, while Ethereum recorded $62.6 million in weekly spot volume.
Is $130 the Next Test for Solana Price?
The SOL price soared to $121.23 on September 29, extending its recovery from below $100 earlier this month.
On September 27, Solana price momentarily climbed to near $125 before falling back to around $120. Solana has since recovered, with the closest support being $120.
A Long-term SOL projection trend beyond $125 would put $130 in the spotlight as the next target on the upside. In case the price of Solana drops below $120, the chart indicates additional support at $115 and $110.

The four-hour RSI stood at 55.99, suggesting momentum has improved.
However, the MACD line remained below its signal line, and the histogram was negative. Those readings leave a move through $125 unconfirmed.
Instant Currency Exchange at BestChange with Ease
- Compare Rates Across 1000+ Exchanges
- Access 250+ Cryptocurrencies & Pairs
- Save Time with Real-Time Price Tracking
- Trusted & Verified Exchange Listings

Frequently Asked Questions (FAQs)
1. Why is Analyst Charts watching $150?
2. Which Solana ETF led the weekly inflows?
Why Trust CoinGape
CoinGape has covered the cryptocurrency industry since 2017, aiming to provide informative insights Read more…to our readers. Our journal analysts bring years of experience in market analysis and blockchain technology to ensure factual accuracy and balanced reporting. By following our Editorial Policy, our writers verify every source, fact-check each story, rely on reputable sources, and attribute quotes and media correctly. We also follow a rigorous Review Methodology when evaluating exchanges and tools. From emerging blockchain projects and coin launches to industry events and technical developments, we cover all facets of the digital asset space with unwavering commitment to timely, relevant information.



Delivered every day.
- Insights that move markets
- 100,000 active subscribers

CRYPTO IMPACT AWARDS 2026