




Where Could Bitcoin Price Be By The End Of 2026?





Highlights
- Kalshi traders assign 61% probability to Bitcoin price slipping below $55,000.
- Liquidations reach $1.57 billion, alongside $582 million Bitcoin ETF outflows.
- Bearish MACD and oversold RSI highlight weakness despite rebound potential.
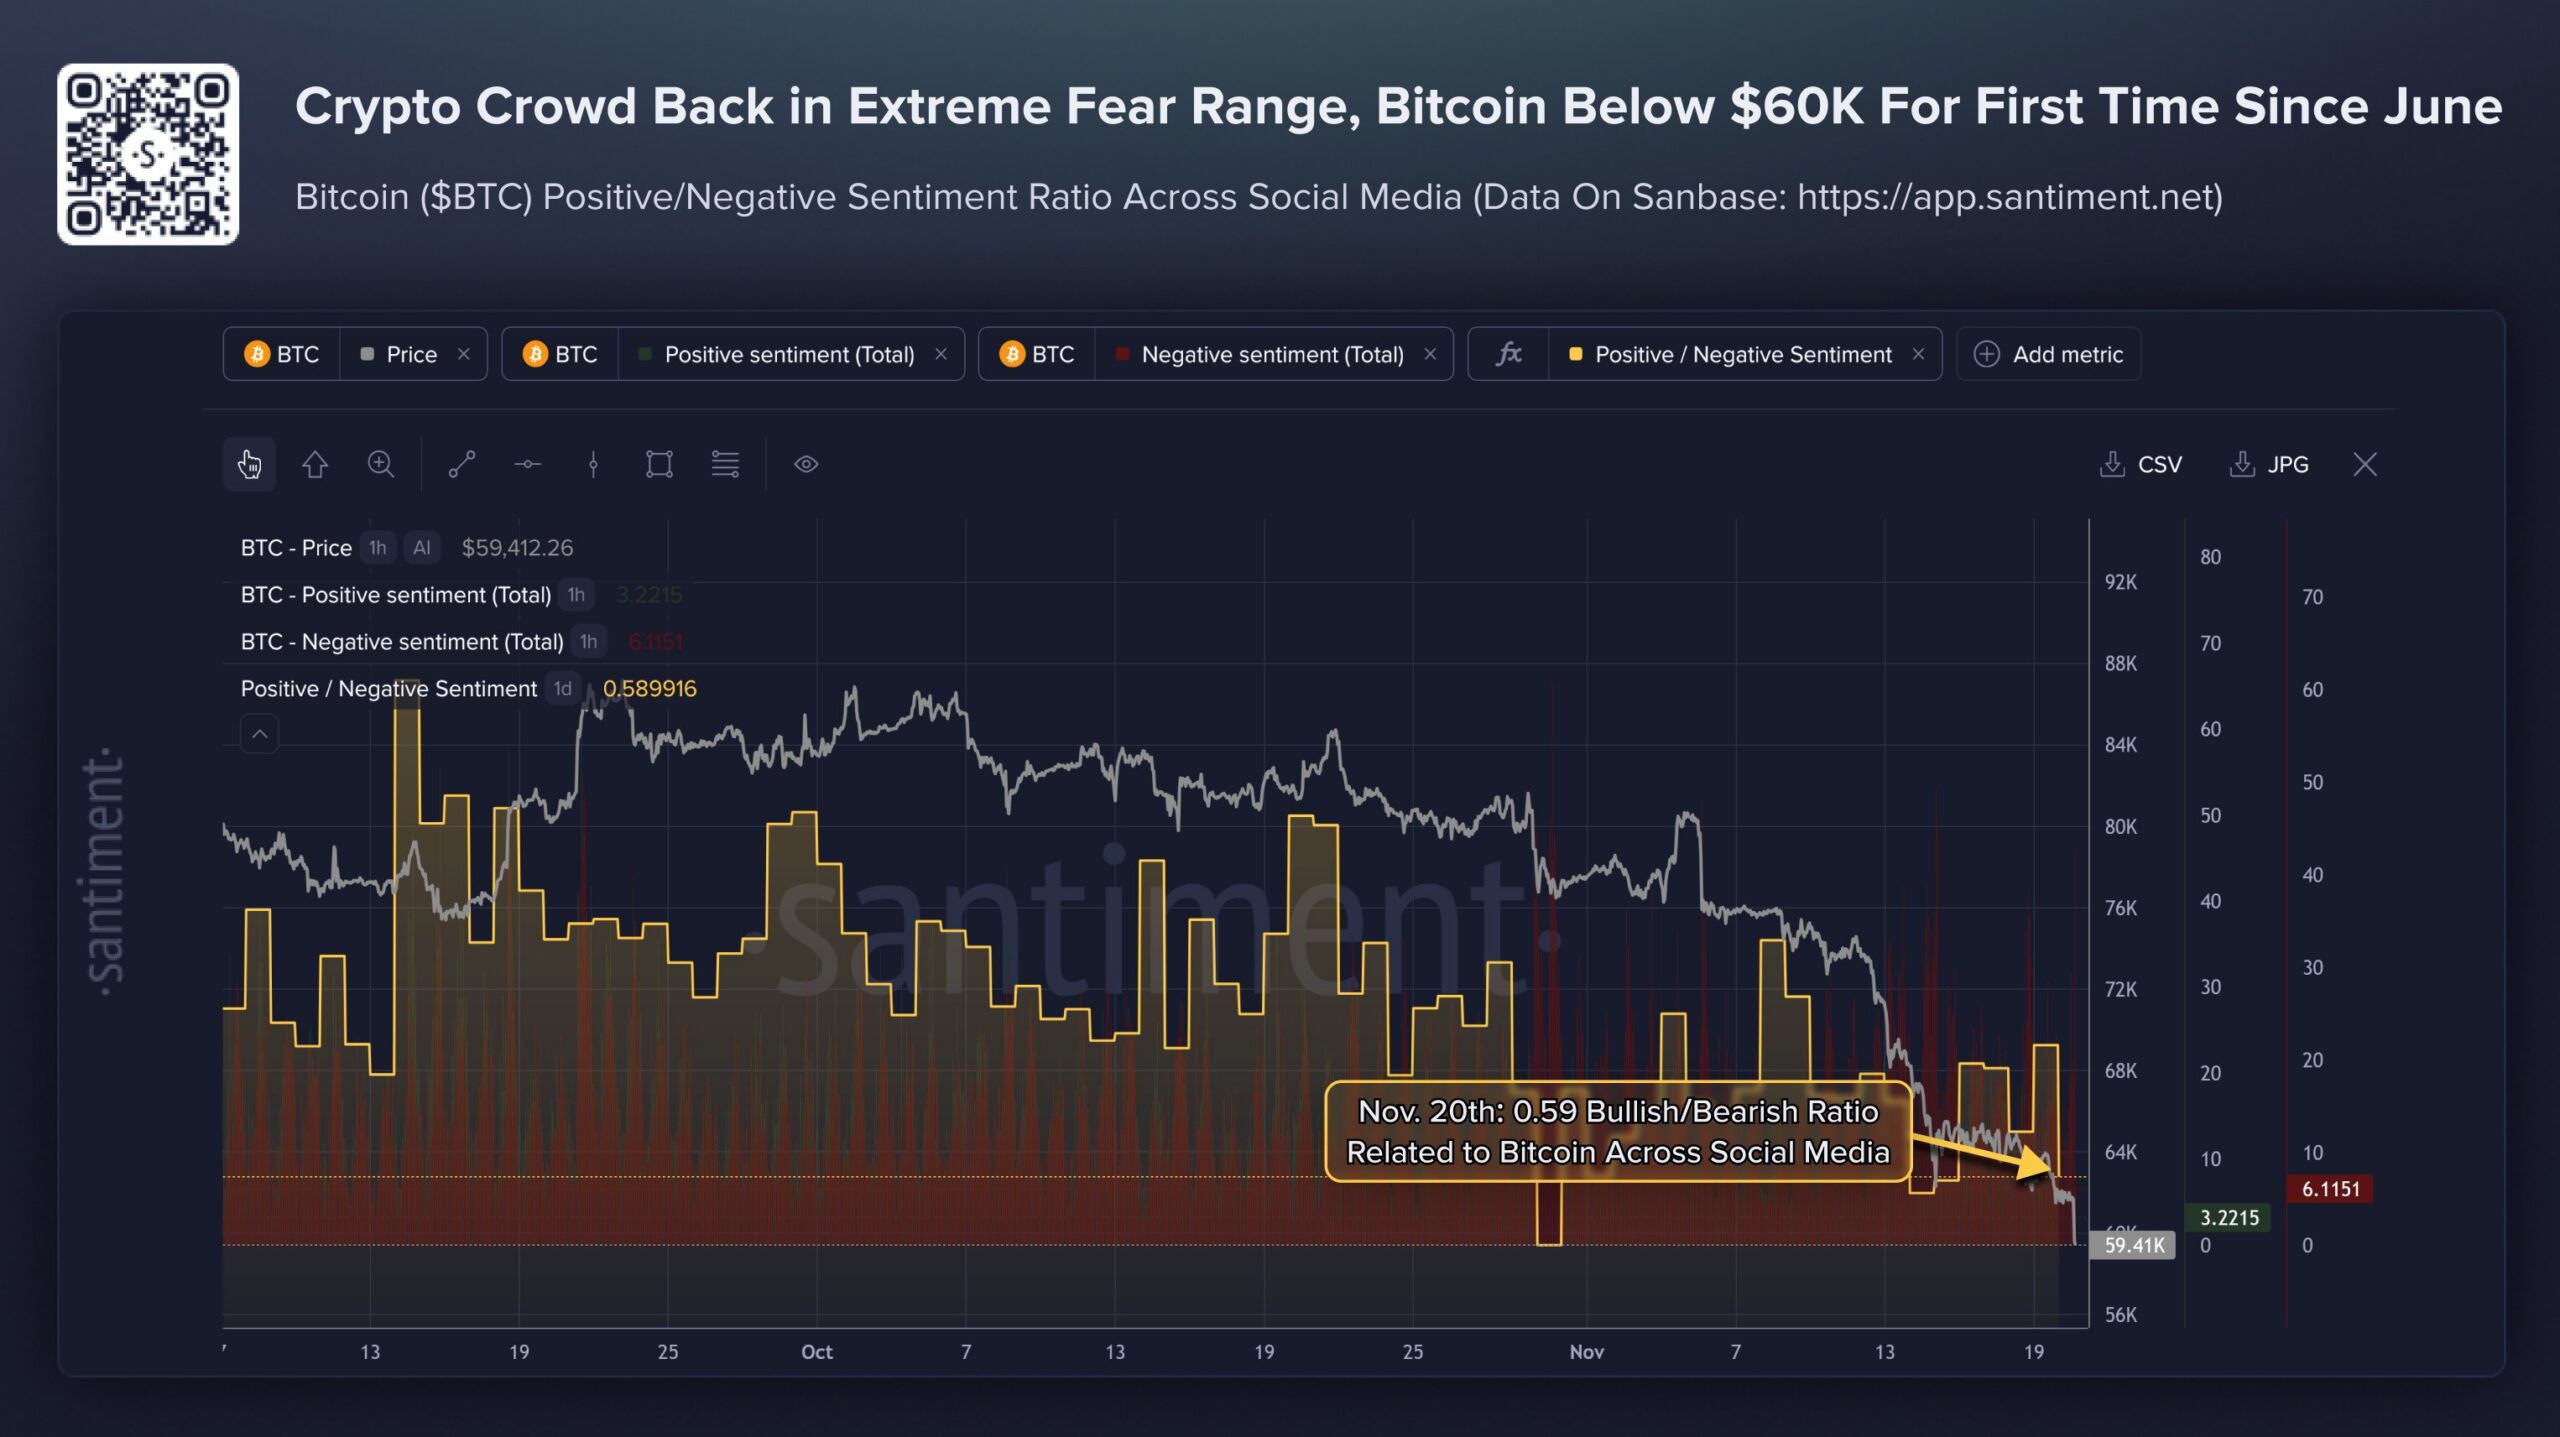
Bitcoin Price slipped below $60,000 on November 20, deepening uncertainty over where the cryptocurrency could finish 2026. The broader crypto market lost 5.21% over 24 hours, reducing its total value to $2.03 trillion.
Bitcoin price traded at $59,378 after reaching an intraday low of $58,768.73. Those losses arrived alongside a wider retreat across technology shares and digital assets, raising concerns about another liquidation cascade.
Bitcoin is Now Projected to Drop Below $55K This Year.
Kalshi’s November 20 update placed the most likely year-end range between $60,000 and $65,000, with a 22% probability. The market median stood at $60,600, while traders assigned a 61% chance of Bitcoin falling below $55,000 during 2026.
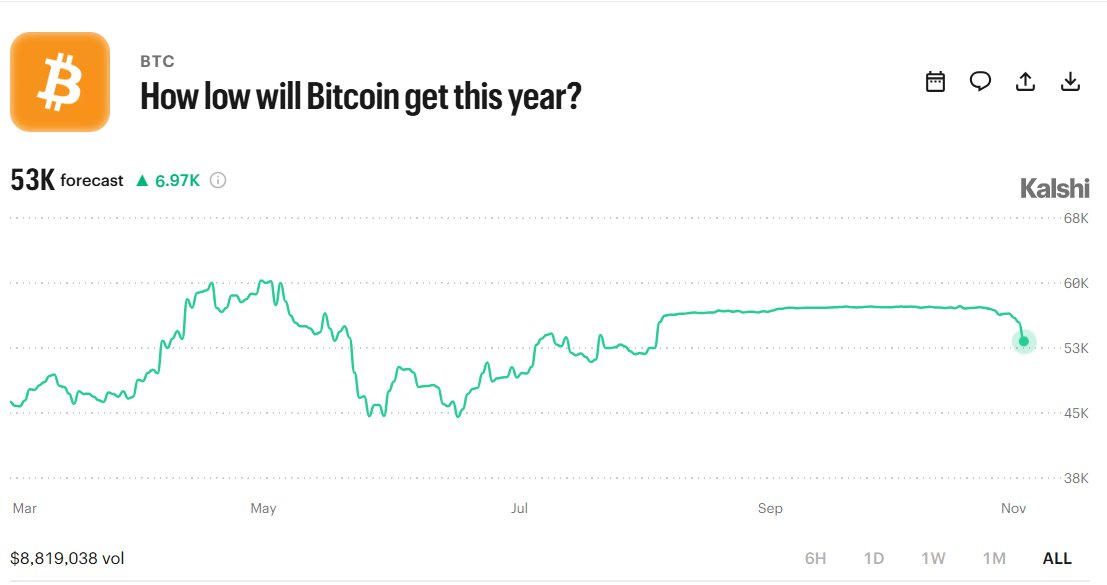
These probabilities reflect traded contracts and can change quickly as participants react to prices and new information.
That downside contract concerns a price reached before December ends, rather than Bitcoin’s final closing level. The figures therefore allow for a deeper decline followed by recovery, although neither outcome is assured.
Crypto Market Crashes as Liquidations Reach $1.57 Billion
CoinGlass figures cited in the market update showed $1.57 billion liquidated across cryptocurrencies within 24 hours. Long positions accounted for $1.42 billion, compared with $143.23 million in short positions.
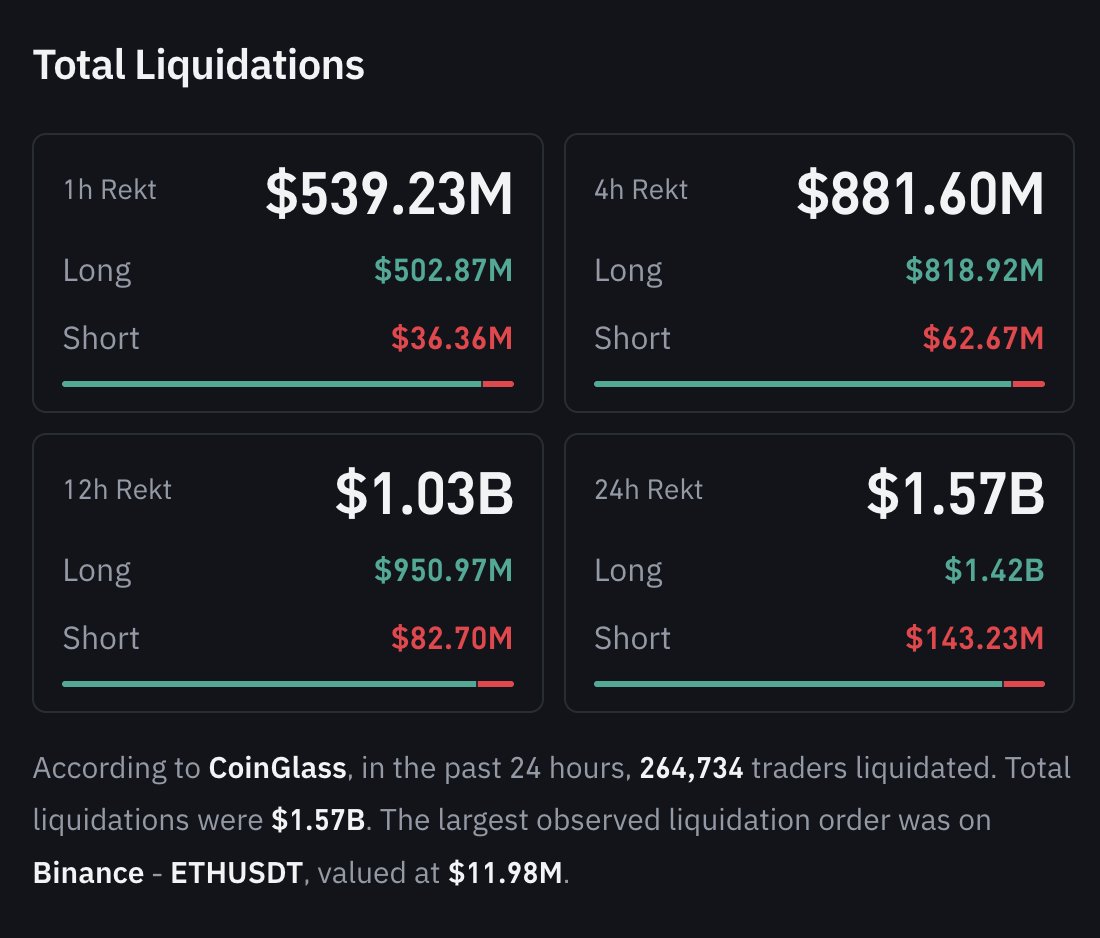
Approximately 264,734 traders were affected, highlighting the scale of leveraged exposure caught in the downturn. The largest individual liquidation involved Binance’s ETHUSDT contract, valued at $11.98 million.
When exchanges close leveraged longs, forced selling can deepen declines, especially when available liquidity cannot absorb large orders.
Ethereum traded at $1,644.13, while XRP, Ether, and Solana recorded respective declines of 7%, 8%, and 6%.
BTC ETF Outflows Extend Pressure on Demand
Spot Bitcoin ETFs recorded $582 million in net outflows on November 19, extending withdrawals into a third consecutive session. Spot Ethereum funds lost $131 million, marking their fifth straight day of net redemptions.
Spot Bitcoin ETFs See $582 Million in Net Outflows on November 19, Marking Third Consecutive Day
On November 19 (ET), spot Bitcoin ETFs recorded total net outflows of $582 million, their third consecutive day of net outflows. Spot Ethereum ETFs recorded total net outflows of $131 million, marking their fifth consecutive day of net outflows.
— Wu Blockchain (@WuBlockchain) November 20, 2026
Persistent withdrawals suggest weaker appetite for exposure through regulated funds, potentially limiting support during Bitcoin’s decline. Spot Ethereum ETFs recorded total net outflows of $131 million, marking their fifth consecutive day of net outflows.
Bitcoin Price Prediction: Key Levels to Watch
The immediate technical question is whether future Bitcoin outlook can reclaim $60,000 and sustain that level through a weekly close. A weekly finish below this threshold would strengthen the bearish scenario, with $58,768.73 providing the nearest reference low.
Further weakness could bring $55,000 into focus, although this remains a conditional target rather than a confirmed destination. On recovery, $60,000 would represent the first hurdle, followed by the $65,000 area highlighted in prediction markets.
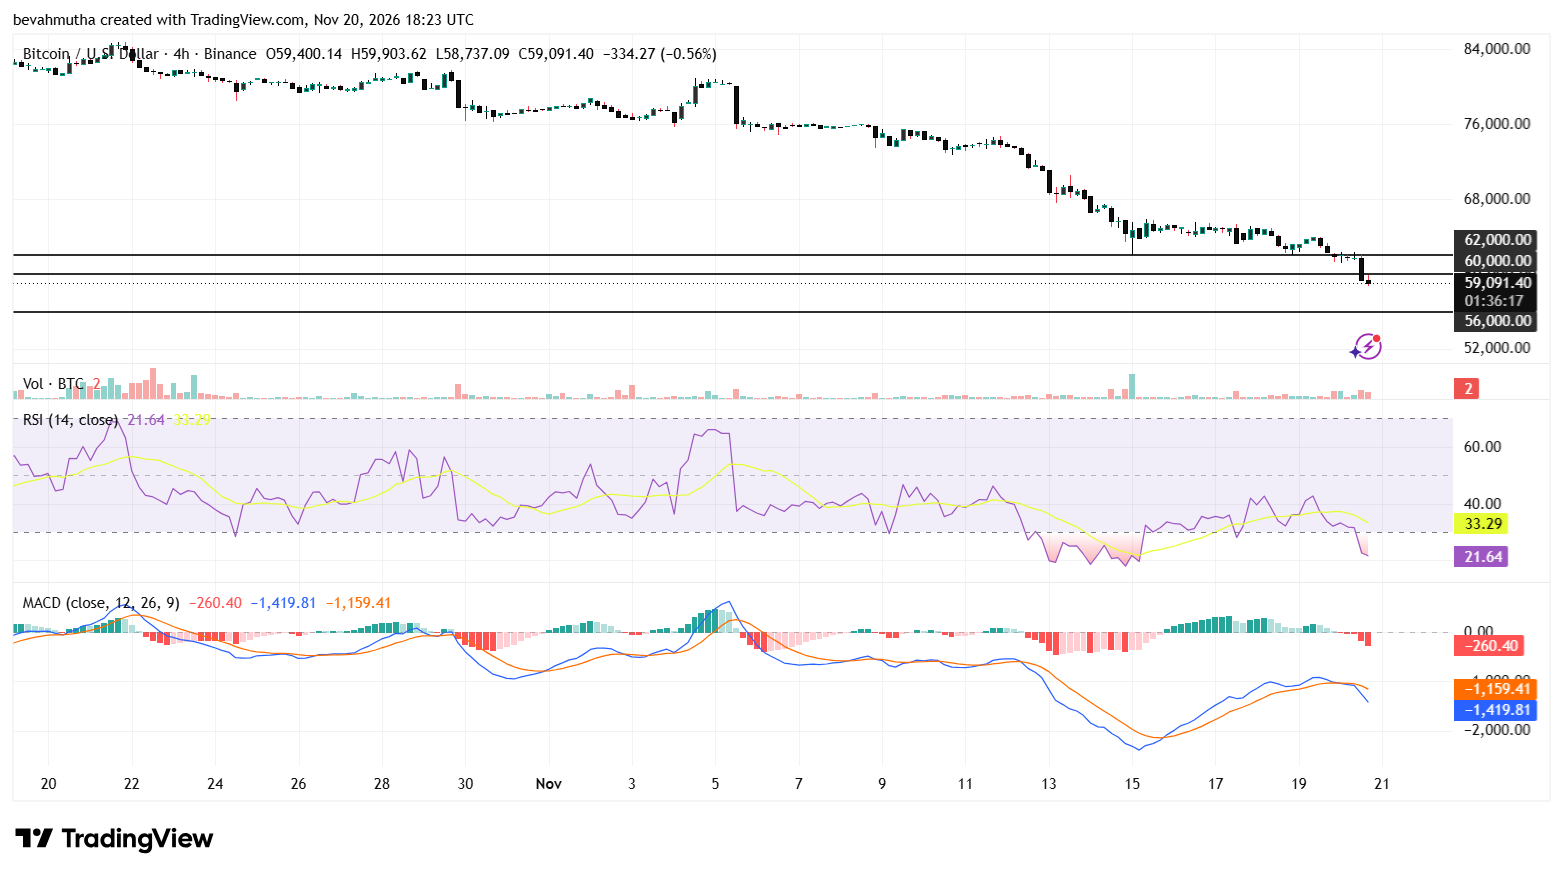
Bitcoin’s four-hour MACD shows bearish momentum, with the MACD line at -1,425.91 below the signal line at -1,160.63. The histogram reads -265.28, while expanding red bars indicate increasing downward pressure. A bullish crossover would suggest that bearish momentum is weakening.
The RSI stands at 21.43, below the oversold threshold of 30. This reading reflects strong selling pressure, although deeply oversold conditions can precede a temporary rebound.
Instant Currency Exchange at BestChange with Ease
- Compare Rates Across 1000+ Exchanges
- Access 250+ Cryptocurrencies & Pairs
- Save Time with Real-Time Price Tracking
- Trusted & Verified Exchange Listings

Frequently Asked Questions (FAQs)
1. How can Bitcoin fall below $55,000 and still finish 2026 above $60,000?
2. What does the dominance of long liquidations reveal about the selloff?
Why Trust CoinGape
CoinGape has covered the cryptocurrency industry since 2017, aiming to provide informative insights Read more…to our readers. Our journal analysts bring years of experience in market analysis and blockchain technology to ensure factual accuracy and balanced reporting. By following our Editorial Policy, our writers verify every source, fact-check each story, rely on reputable sources, and attribute quotes and media correctly. We also follow a rigorous Review Methodology when evaluating exchanges and tools. From emerging blockchain projects and coin launches to industry events and technical developments, we cover all facets of the digital asset space with unwavering commitment to timely, relevant information.

24 Hours volume
$21.19B
Market Cap
$1.69T
Max Supply
21M



Delivered every day.
- Insights that move markets
- 100,000 active subscribers

CRYPTO IMPACT AWARDS 2026