XRP Price Forecast: Wedge Pattern Signals Rally to $1.70 as Ripple CEO Predicts Record Year



Highlights
- XRP price is up by 31% in three days as buying pressure surges.
- A bullish wedge pattern on the weekly chart suggests the price could rally to $1.71.
- XRP ETFs have registered their biggest single-day inflows since June as institutional demand returns
Ripple (XRP) price is up by 21% today, August 22, to trade at $1.58 at the time of writing. The gains come amid a surge in buying pressure, with data from CoinMarketCap showing that trading volumes are up by 107% in 24 hours to $16.87 billion. The rising volumes are likely coming from Upbit, as traders rotate from KOSPI to Ripple.
XRP is now forming a falling wedge pattern on the weekly chart that usually suggests that the downtrend that pushed the price from $1.94 in January to $0.99 in August could be over. Meanwhile, Ripple’s CEO Brad Garlinghouse opines that the company will have a record year.


Garlinghouse Says Ripple Will Have a Record Year
Garlinghouse was speaking at the Wyoming Blockchain Symposium, where he said that Ripple is on the verge of doubling its revenue in 2026. He attributed this increase in revenue to the acquisitions of Hidden Road and GTreasury in 2025.
His remarks also come at a time when Ripple is expanding its footprint in the traditional finance space. A recent report by CoinGape noted that Ripple is partnering with Clearpool and Cicada to bring institutional credit to the XRP Ledger.
During the Wyoming Blockchain Symposium, Garlinghouse also sparked speculation of Ripple filing for an IPO, saying that the company is no longer entirely opposed to going public.
“We’ve been very happily private for a long time… we are more neutral on the topic than maybe we used to be,” he said.
These remarks coincide with a bullish sentiment across the crypto market that has seen the price of XRP gain by 31% in three days.


XRP Price Creates a Bullish Wedge Pattern
The price of XRP is forming a falling wedge pattern on the weekly chart. This pattern usually suggests that the trend is changing from a bearish one to a bullish one.
XRP has also moved above the resistance at the upper trendline of the wedge pattern. Still, it has to close above this resistance to confirm the bullish outlook to move to the next obstacle at $1.71.
The RSI that has moved from an oversold reading of 30 on August 10 to 49 today, August 21, also confirms that the trend is shifting. The current RSI reading shows that selling pressure has eased, and the price of XRP could extend the gains.
The value of XRP today is also testing the resistance at the 200-day EMA of $1.36. If it moves above this EMA, it will confirm that the long-term trend is changing to favor bulls.
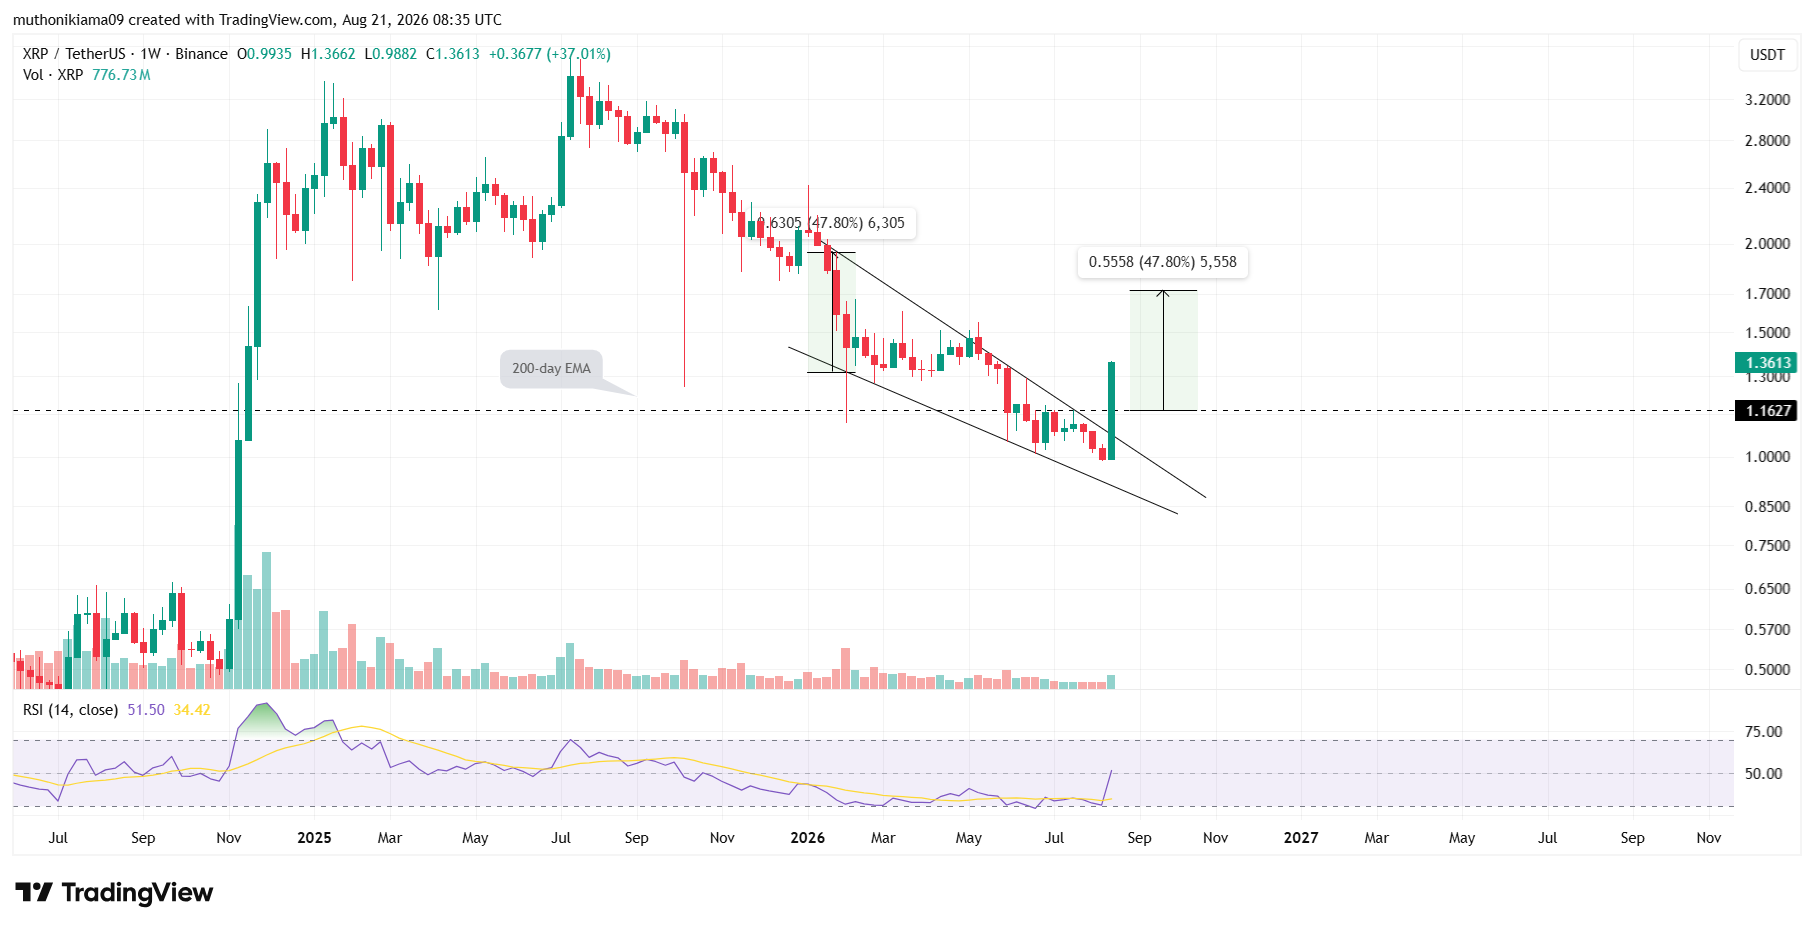
If this bullish thesis fails and XRP price fails to close above the 200-day EMA, it might drop to the psychological support of $1.20.
XRP ETF Volumes Reach $125 million
Data from SoSoValue shows that the total value traded for XRP ETFs has reached $94 million. The Bitwise XRP ETF accounts for the biggest share of these volume numbers, with $65 million traded since the product launched.
The recent 31% gain in XRP price has also increased the demand for XRP ETFs, because they recorded $18.38 million in inflows on August 21. This marks the biggest single-day inflows recorded by the ETFs since May 2026.
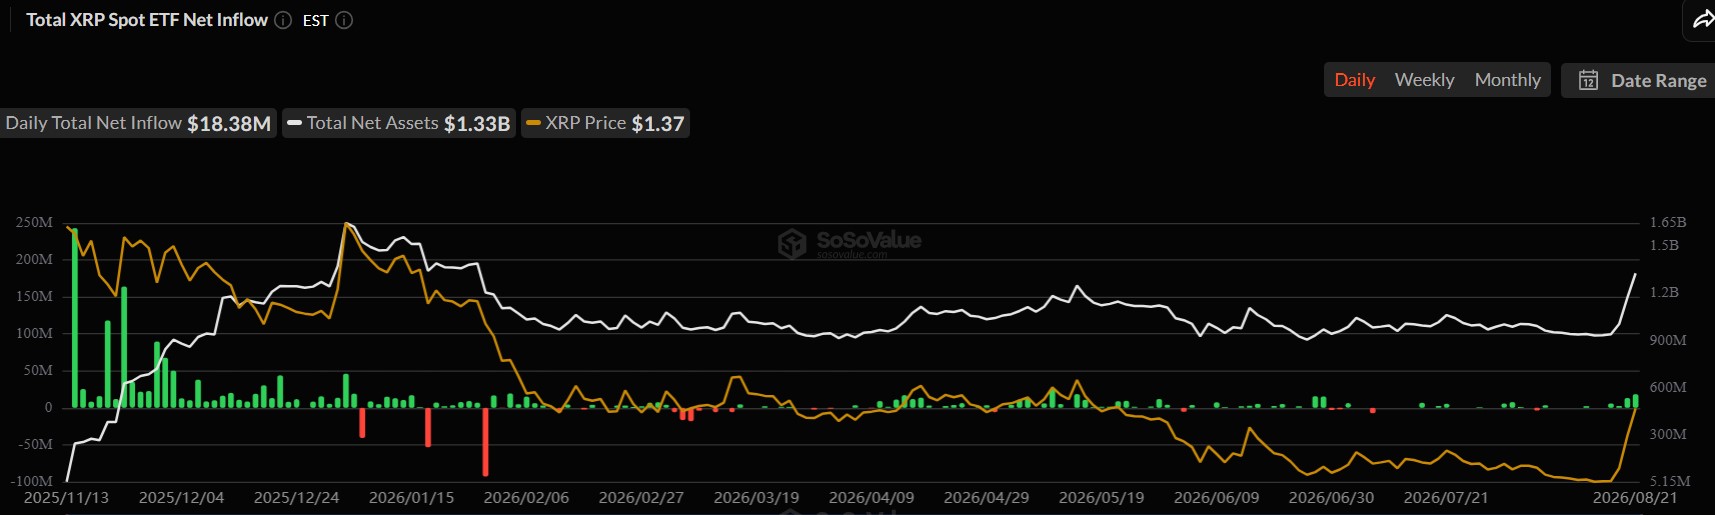
The surge coincides with surging demand for all crypto ETFs after the total inflows to BTC ETFs reached $307 million on August 21, while Ethereum ETFs had $184 million in inflows.
Instant Currency Exchange at BestChange with Ease
- Compare Rates Across 1000+ Exchanges
- Access 250+ Cryptocurrencies & Pairs
- Save Time with Real-Time Price Tracking
- Trusted & Verified Exchange Listings

Frequently Asked Questions (FAQs)
1. Why is XRP price rising today?
2. How high could XRP price go?
3. Can XRP price reach $3 again?
Why Trust CoinGape
CoinGape has covered the cryptocurrency industry since 2017, aiming to provide informative insights Read more…to our readers. Our journal analysts bring years of experience in market analysis and blockchain technology to ensure factual accuracy and balanced reporting. By following our Editorial Policy, our writers verify every source, fact-check each story, rely on reputable sources, and attribute quotes and media correctly. We also follow a rigorous Review Methodology when evaluating exchanges and tools. From emerging blockchain projects and coin launches to industry events and technical developments, we cover all facets of the digital asset space with unwavering commitment to timely, relevant information.

24 Hours volume
$1.19B
Market Cap
$80.81B
Max Supply
100B



Delivered every day.
- Insights that move markets
- 100,000 active subscribers

CRYPTO IMPACT AWARDS 2026