Chainlink Price Outlook as LINK ETF Extends Inflow Streak to Three Straight Days



Highlights
- Chainlink price is maintaining a $14 support level with $15 resistance marking breakout.
- LINK ETFs saw $2.62 million flow in, continuing three days of inflows.
- Open interest reached $771.91 million as trading volume fell 21.53%.
Chainlink price increased 0.95% to $14.44 over 24 hours, with the token’s movement largely following Bitcoin’s rally.
The LINK price surged by more than 30% over the past month following the CCIP 2.0 Launch as the token eyes $20 level.
The modest advance coincided with a LINK ETF recording its third consecutive day of inflows. Positive regulatory developments supported sentiment, pushing total market capitalization up 2.37% to $2.93 trillion.
Bitcoin price hovered above $86,000 after a strong climb over the past day, while Ethereum traded above $2,700. XRP rose 3% to $1.53 over the same period, adding to the broader market’s positive daily performance.


Chainlink ETF Extends Inflow Streak to Three Straight Days
The two Chainlink exchange-traded funds recorded $2.62 million in net inflows on October 1, according to SoSoValue data. Bitwise’s CLNK attracted the entire daily inflow, while Grayscale’s GLNK reported no net change.
Combined inflows reached $168.96 million, while total net assets stood at $244.34 million. Those assets, held across the two NYSE-listed funds, represented 2.27% of LINK’s overall market capitalization.
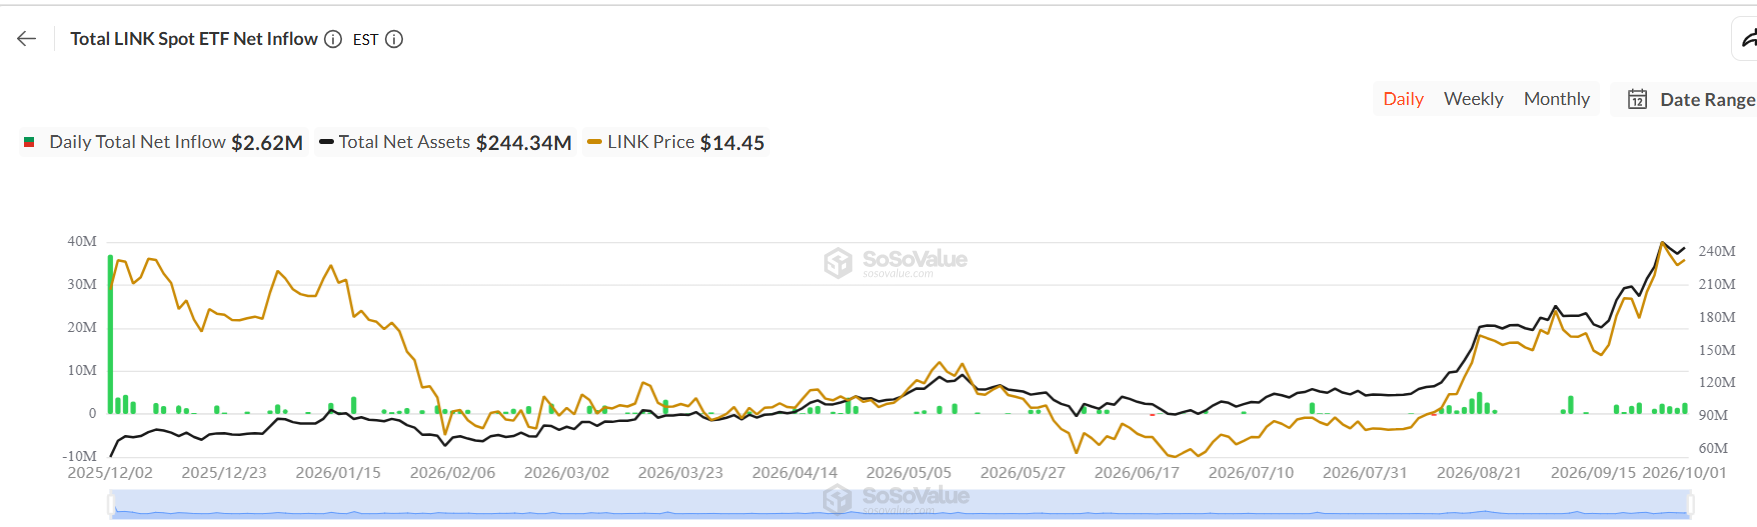
The weekly view showed $8.30 million in net inflows, with LINK quoted at $14.45. Daily trading across both funds totaled $14.99 million, with Grayscale accounting for $14.56 million. Grayscale held $175.69 million in net assets, compared with Bitwise’s $68.64 million.


Is Chainlink Price Preparing for a Breakout Above $15?
The LINK price traded at $14.451 on October 2, rising 0.56% in the latest four-hour candle. Chainlink held above $14 support after retreating from its late-September peak. The narrow range trading observed on the recent candles kept trading below $15 resistance.
The four-hour relative strength index stood at 52.27; this reading suggested a modest positive bias, although momentum remained close to neutral.
The MACD line registered 0.048, trailing the signal line at 0.083. Its histogram remained negative at -0.035, indicating that bearish momentum was still present.
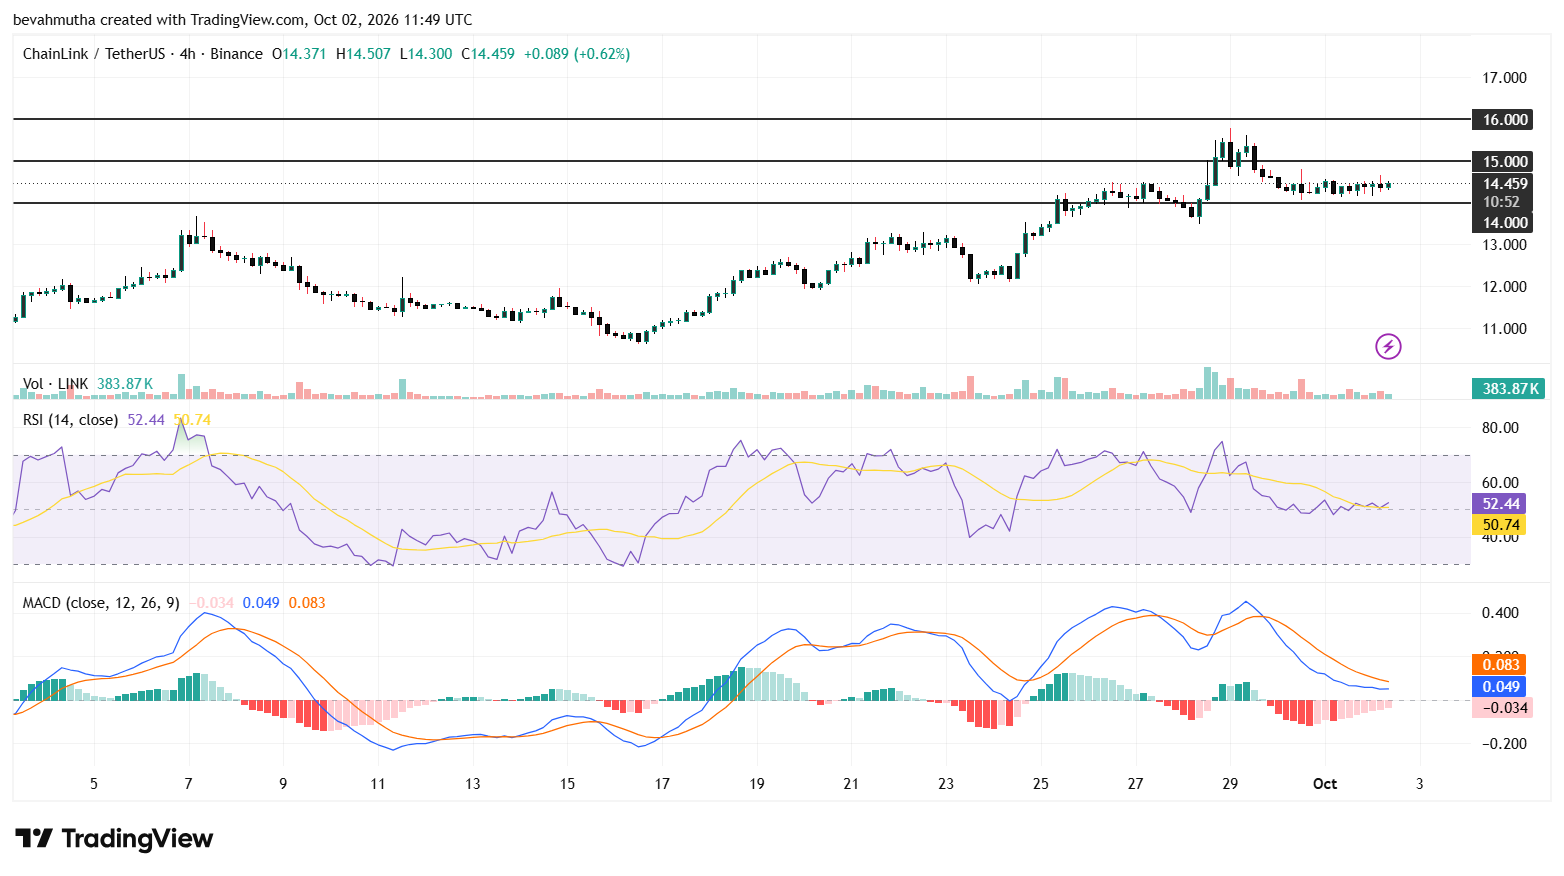
A sustained move above $15 could open the way toward the next resistance at $16 for the detailed LINK price analysis.
Holding $14 would preserve the recent consolidation structure and support another attempt at resistance.
Failure to defend that level could bring the previous trading area near $13 back into focus. A deeper decline could test the September support zone around $12.20, where an earlier rebound developed.
Chainlink Open Interest Nears $772M Despite Falling Trading Volume
Chainlink derivatives market saw a 21.53% drop in trading volume, which resulted in trading turnover of $589.69 million.
There was a 21.53% decrease in trading volume on the Chainlink derivatives market, with the total turnover of $589.69 million. Only a slight decrease in the value of outstanding contracts as open interest, the number of contracts outstanding, increased 0.08% to $771.91 million.
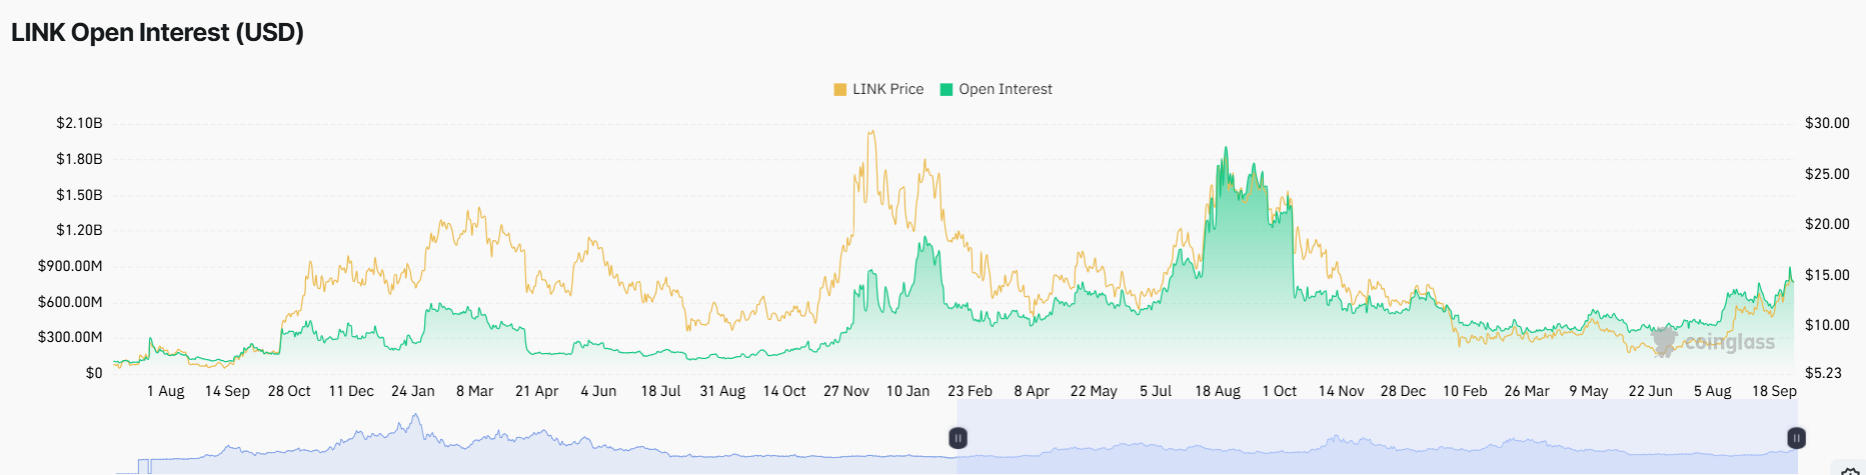
The figures show lower trading volumes, but relatively flat derivatives exposure. Volume represents the number of contracts traded in a period and Open Interest represents the number of contracts that are held open.
Instant Currency Exchange at BestChange with Ease
- Compare Rates Across 1000+ Exchanges
- Access 250+ Cryptocurrencies & Pairs
- Save Time with Real-Time Price Tracking
- Trusted & Verified Exchange Listings

Frequently Asked Questions (FAQs)
1. Could Chainlink break above $15?
2. Which Chainlink ETF holds more assets?
Why Trust CoinGape
CoinGape has covered the cryptocurrency industry since 2017, aiming to provide informative insights Read more…to our readers. Our journal analysts bring years of experience in market analysis and blockchain technology to ensure factual accuracy and balanced reporting. By following our Editorial Policy, our writers verify every source, fact-check each story, rely on reputable sources, and attribute quotes and media correctly. We also follow a rigorous Review Methodology when evaluating exchanges and tools. From emerging blockchain projects and coin launches to industry events and technical developments, we cover all facets of the digital asset space with unwavering commitment to timely, relevant information.

24 Hours volume
$1.23B
Market Cap
$11.52B
Max Supply
1000M



Delivered every day.
- Insights that move markets
- 100,000 active subscribers

CRYPTO IMPACT AWARDS 2026